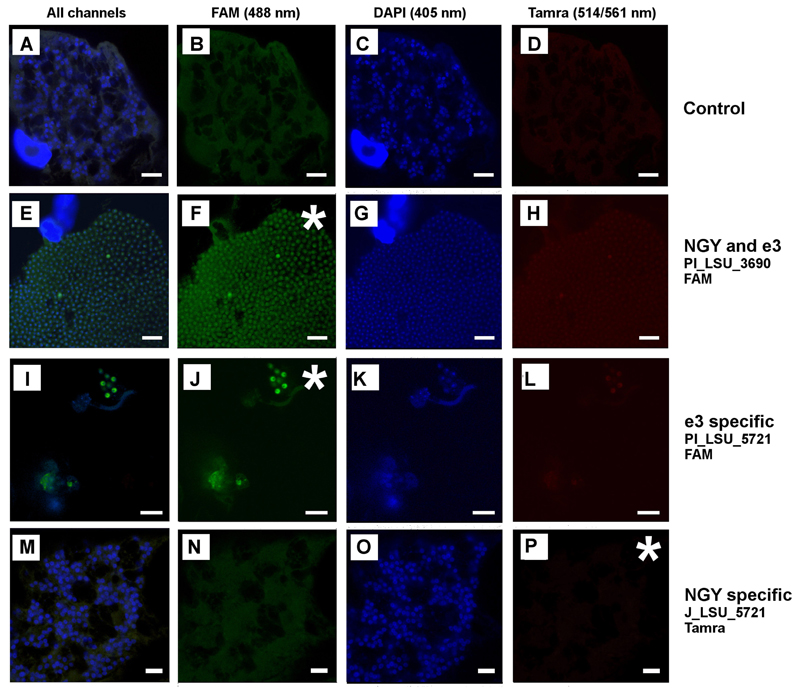
Figure 4.
FISH images of P. brassicae, an asterisk is used to highlight the channel where the respective probe should be visible. All images which were created using the same excitation wavelength are arranged vertically, while horizontally all samples were treated with the identical probe. Fig. 4M–P show sporogenic plasmodia of P. brassicae. Images E–H show resting spores. In Fig. 4E–H a germinating fungal spore can be seen in between the resting spores and the plasmodium. The difference in the appearance of the nuclei is linked to the different life cycle stages: Nuclei are very small and condensed in the resting spores (Fig. 4G, K) while the nuclei of actively growing plasmodia resemble doughnuts, which is caused by the characteristic cruciform nuclear division (Fig. 4C, O, see also Fig. 3G, K). Differences in the intensity of the FISH signal such as in in Fig. 4F or J, but also like in Fig. 3F or J can be explained by the aging of P. brassicae, with the strongest signal in the most active cells, the dividing plasmodia and a fading signal in the resting spores. The control images in Fig. 4A–D are identical with Fig. 3A–D. Bars = 10 µm

