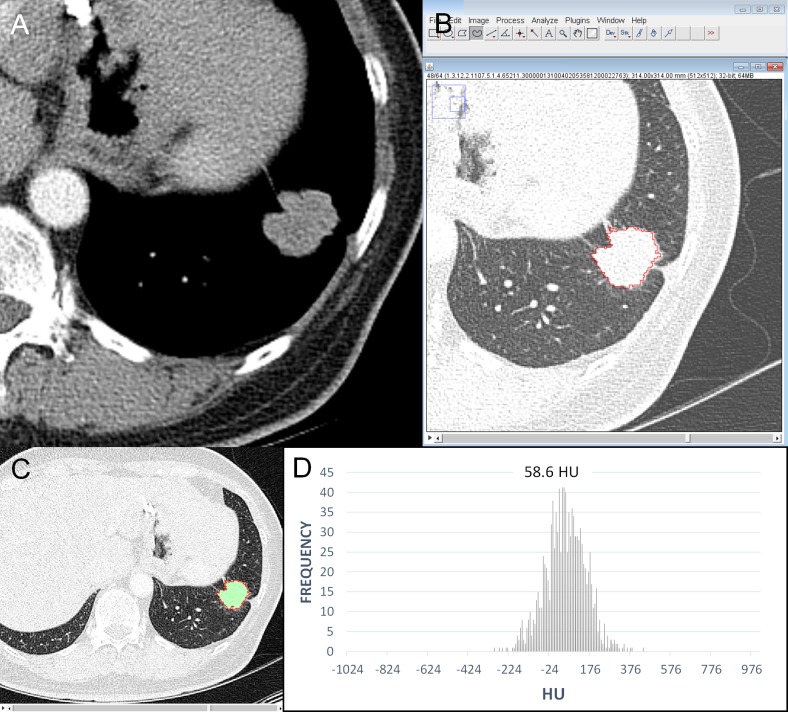
Fig 2. An example of quantitative CT analysis in a recurred adenocarcinoma.
(A) CT scan and (B) screenshot of quantitative analysis show a 2.8-cm irregular nodule in the left lower lobe. The TNM stage was T1bN0M0 with stage IA. (C) The graph shows CT number (Hounsfield unit) distribution of the tumor. The perimeter of the tumor was 95.50 mm; area of tumor was 409.96 mm2; mean attenuation, 58.61 HU (Hounsfield unit); circularity, 0.57; aspect ratio 1.15; roundness, 0.87; skewness, -0.018; kurtosis, 0.39; and entropy, 7.01.

