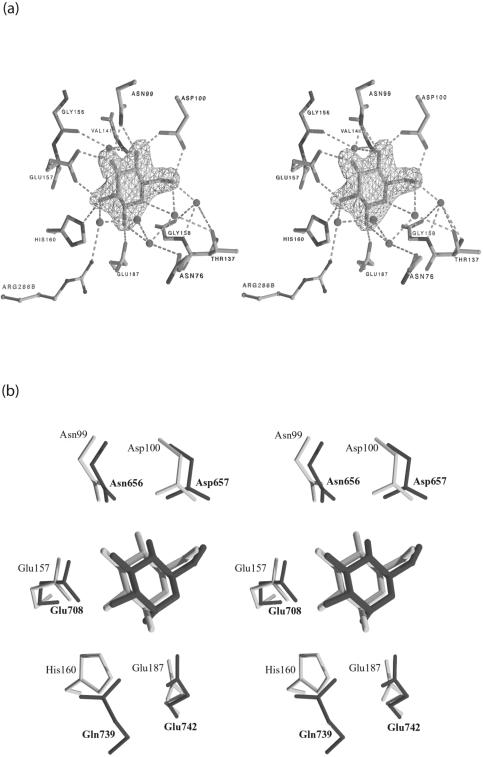
FIG. 6.
(a) Fo-Fc omit map of the ecGlK active site region, showing electron density for glucose. Glucose and water molecules were omitted prior to refinement. This map is contoured at the level of 3σ. Hydrogen bonds between glucose and ecGlK active site residues and waters are shown as dashed lines. (b) Structural superposition of the active site regions of ecGlK-glc (light gray) and human brain hexokinase I (PDB 1DGK; dark gray) depicted in stereo. The superposition was generated by using the atoms of the glucose molecule and residues corresponding to Asn99, Asp100, Glu157, and Glu187 of ecGlK.

