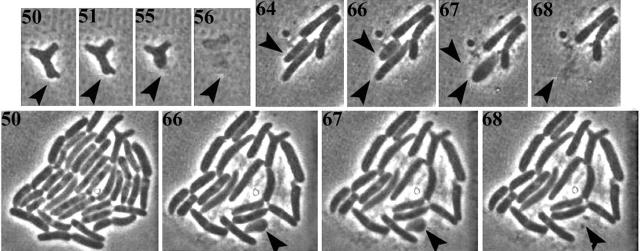
FIG. 4.
Time-lapse photomicroscopy of lysis of E. coli ftsZ84 ΔPBP 5 ΔPBP 7. Numbers indicate minutes elapsed after microcolonies on agar slides were shifted to 42°C. Arrowheads indicate individual cells that lyse over time. Comparing the large colony at 50 and at 68 min reveals that many cells lysed over that period.

