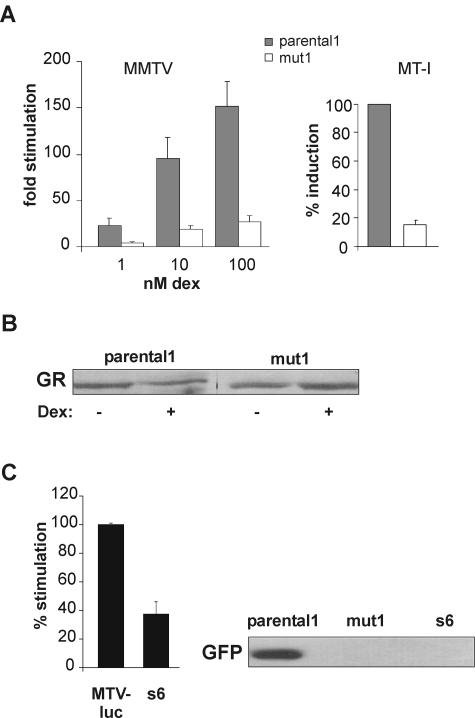
FIG. 3.
Analysis of the cell line mut1. (A) Left panel, transient luciferase assays in mut1 cells compared to parental1 cells. Cells were transiently transfected with MTV-Luc and pCMVβ-Gal to control for the transfection efficiency. Increasing concentrations of dex were applied for 16 h. The means of stimulation relative to luciferase activity in the absence of hormone + standard errors of the means of the results from five independent experiments are displayed. Right panel, inducibility of MT-I mRNA in the two cell lines. Total RNA was prepared from cells stimulated with 1 μM dex for 24 h, and RT-PCR was performed. Induction in parental1 cells is set to 100%. Means + standard errors of the means of the results from three independent experiments are shown. (B) GR levels in parental1 and mut1 cells. Representative Western blots of total cell extracts with (+) or without (−) hormone are displayed. (C) Analysis of s6, a fusion of mut1 and MTV-luc cells. Left panel, luciferase activity from the endogenous MMTV-Luc in s6 and in MTV-luc cells. Stimulation in MTV-Luc cells was set to 100%; mean values + standard errors of the means of the results from four independent experiments are displayed. Right panel, representative Western blot of GFP levels in dex-treated parental1, mut1, and s6 cells.

