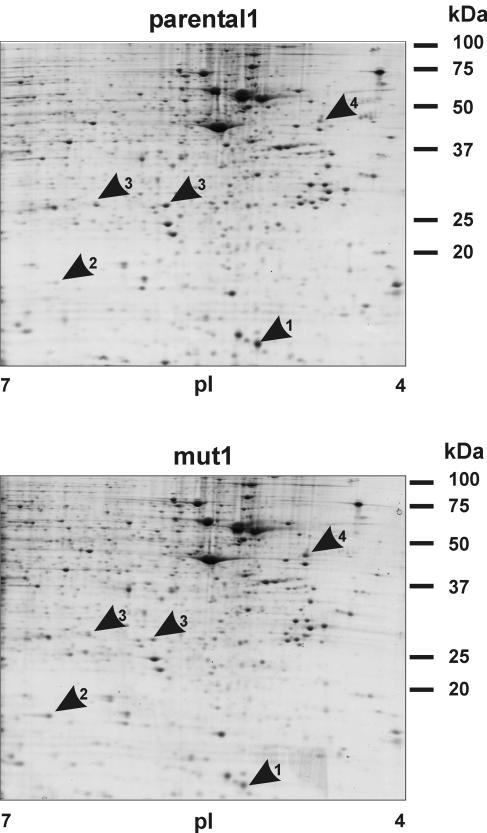
FIG. 4.
2-D gel analysis of mut1 and parental1. Total protein was separated in the first dimension by IEF and in the second dimension by SDS-PAGE. Gels were stained with colloidal Coomassie brilliant blue. Several differentially expressed proteins were detected by visual inspection and confirmed by using PDQuest (Bio-Rad). The spots were excised and analyzed by tandem mass spectroscopy. Arrows mark thioredoxin (1), cofilin (2), 2 forms of hsp27 (3), and reticulocalbin (4).

