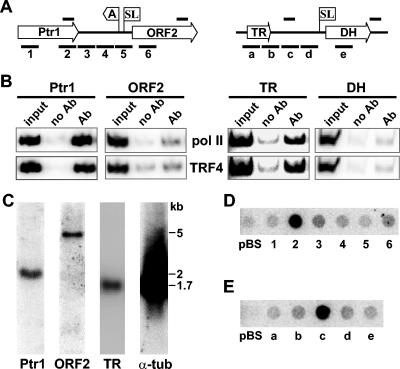
FIG. 7.
Characterization of two TPChIP clones. (A) Graphic representations of TPChIP clones 5 (left) and 8 (right). ORFs are shown as open arrows (Ptr1, pteridine reductase 1; TR, tryparedoxin; and DH, DNA helicase) and the poly(A) and SL addition sites are indicated. For Ptr1, the poly(A) and SL addition sites were determined by sequencing reverse transcription-PCR products, whereas the SL addition site for DH was predicted from the sequence. The solid bars above the drawing indicate the regions amplified in the ChIP assay shown in panel B, and the solid bars below the drawing indicate the DNA fragments used in the dot blot hybridization shown in panels D and E. Drawings are not to scale. (B) ChIP assay for Pol II and TRF4. Ab, antibody. (C) Northern blot analysis with probes specific for the Ptr1 gene, ORF2, TR, and α-tubulin (α-tub). The positions of molecular size standards (in kilobases) are indicated to the right of the blots. (D) Dot blot hybridization of newly synthesized RNA to DNA fragments of about 300 bp, cloned into pBluescript, and spotted onto a nitrocellulose membrane. The numbers refer to the regions indicated below the left drawing in panel A. pBS, plasmid control. (E) Dot blot hybridizations to DNA fragments covering the regions as depicted below the right drawing in panel A. pBS, plasmid control.

