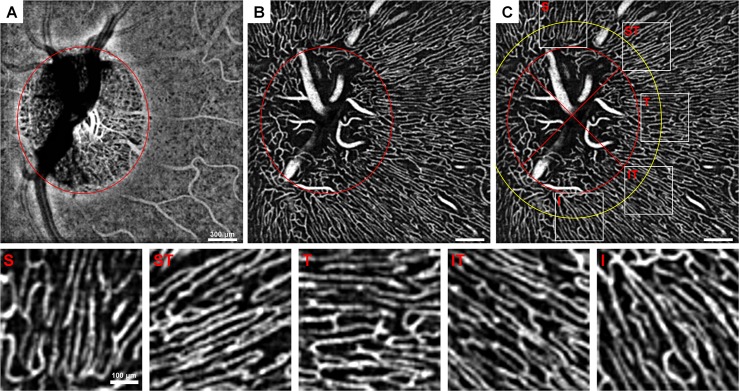
Fig 1. Peripapillary ROI selection demonstrated on 10-frame averaged OCTAs.
(A) Choroidal OCTA and (B) superficial OCTA layers displaying the optic disc margin approximation (red ellipse). (C) Superficial layer with optic disc margin (red ellipse), 1° away from the optic disc margin (yellow ellipse), demarcation of the quadrants (cross in inner ellipse), and the five ~2x2° ROIs from each region. S = superior, ST = superotemporal, T = temporal, IT = inferotemporal, I = inferior. Images were contrast-stretched for display purposes only.

