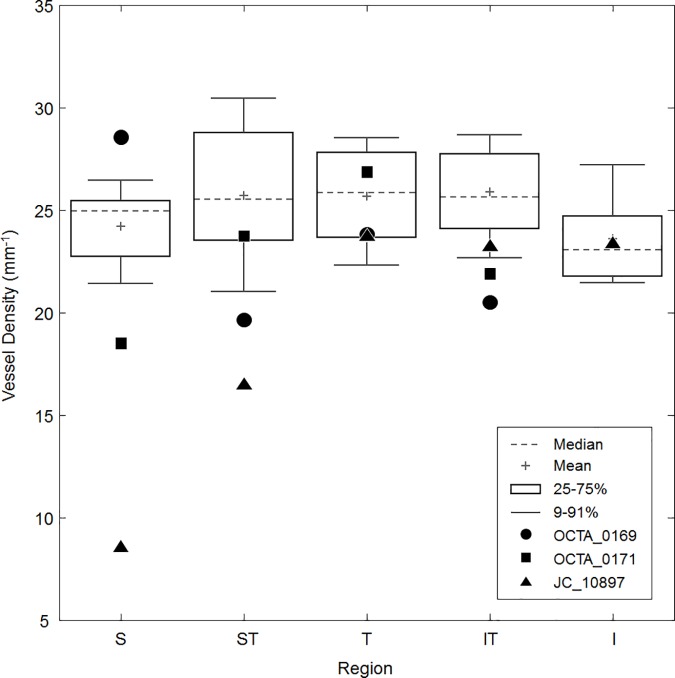
Fig 8. Box plot of healthy control vessel density data generated from 10-frame averaged images overlaid with data from three patients with POAG.
OCTA_0169 (circle) has low density in all regions except superiorly, roughly corresponding the diffuse visual field defects and RNFL thinning from Fig 6. OCTA_0171 (square) has low density in all regions except temporally; this pattern is well-correlated with the RNFL thickness plot, though the visual field does show some minor defects in the superior and superotemporal regions. JC_10897 (triangle) shows densities well below normal in the superior and superotemporal regions, corresponding to the inferior visual field defect and superior RNFL thinning. Density was not measured in the inferior region for OCTA_0169 and OCTA_0171 due to constraints of the image size and presence of many large vessels.

