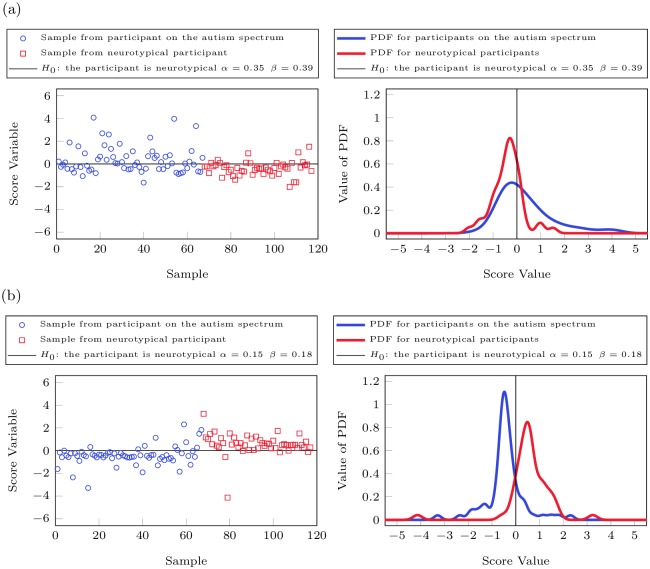
Fig 2. Fisher Discriminant Analysis of urine toxic metal data.
Fig 2(a) shows the score variables and the PDF of the neurotypical participants and the participants on the autism spectrum using FDA while Fig 2(b) contains the same information derived by KFDA. The groups of the neurotypical participants and the participants on the spectrum have different distributions, however, there is significant overlap between the two groups when linear FDA is used. While there is still overlap between the two groups even for KFDA, the distributions becomes more distinct when nonlinear statistical techniques such as KFDA are used.

