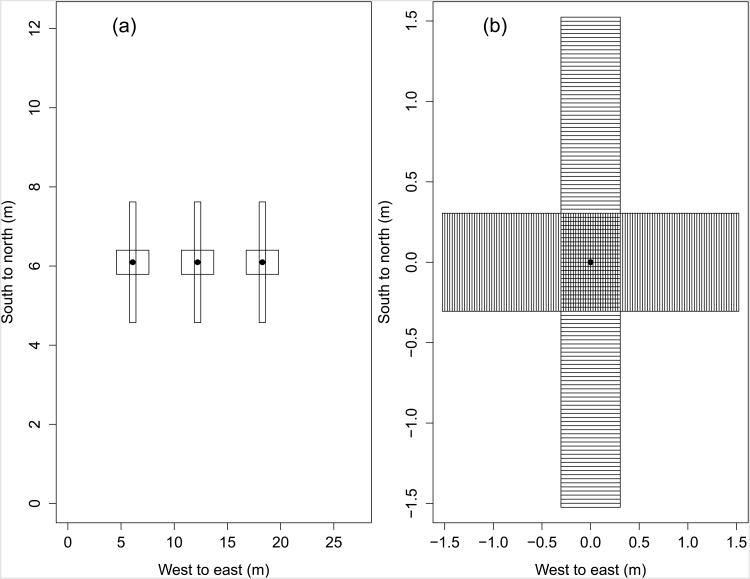
Figure 1.
Plot design. (a) Example of crossing 3.0 × 0.30 m sampling transects used to measure the distribution of wheat stripe rust lesions around initially inoculated leaves (●). (b) All tillers within the crossing rectangles were destructively sampled, with the number of lesions on each leaf recorded. In the crossing region within 0.15 m of the source lesion across or along rows, the coordinates of the tillers were recorded to the nearest 0.025 m. Outside of the crossing region, the quadrant and distance from the source to the midpoint of the bin containing the tiller was recorded.

