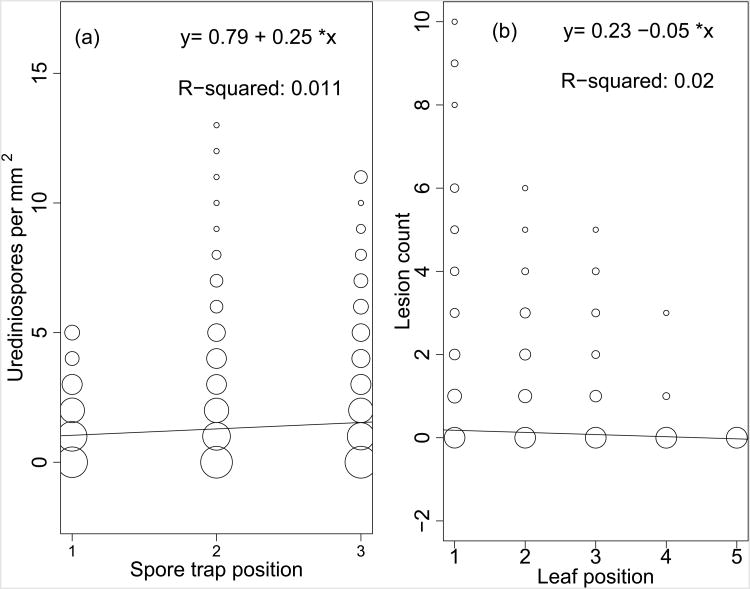
Figure 10.
Vertical distribution of Puccinia striiformis in the plot containing spore traps. (a) The number of urediniospores as a function of spore trap position (1 = 0.75 m, 2 = 0.5 m, 3 = 0.25 m aboveground). (b) The number of lesions as a function of leaf position, which decreases in height sequentially. Point size is equal to 1 + log10 (frequency of observation).

