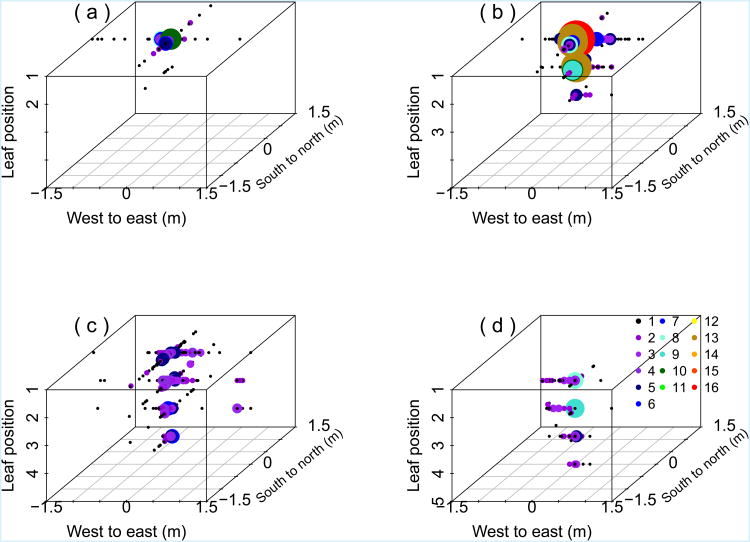
Figure 4.
Three-dimensional maps of lesions, aggregated by leaf position of source lesion. Size and colours of points reflect the number of lesions at each leaf position within a sampling bin. The source lesion was on (a) leaf 1 in plots 5 and 6; (b) leaf 2 in plot 4; (c) leaf 4 in plots 1, 2, 3, 8; (d) leaf 5 in plot 7.

