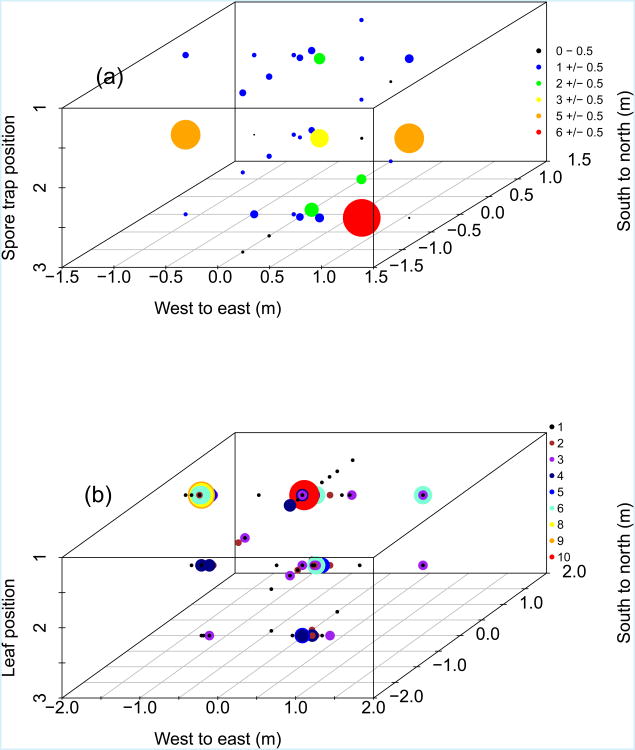
Figure 9.
Three-dimensional maps of (a) the mean number of urediniospores per mm2 per leaf trap, and (b) the total number of lesions in the plot containing the spore traps. Size and colours of points reflect the number of urediniospores or lesions, respectively, at each leaf position within a sampling bin.

