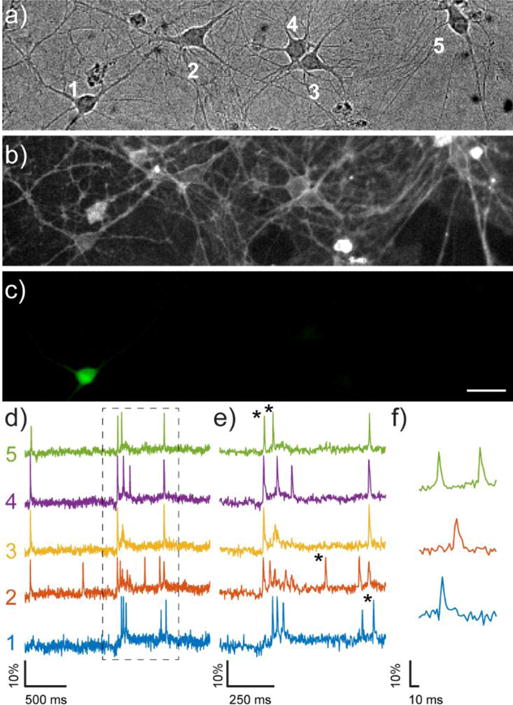
Figure 2.

Imaging spontaneous neuronal activity with RhoVR 1 and GFP. Rat hippocampal neurons (DIC, a) were stained with 500 nM RhoVR (fluorescence, b). A small number of neurons transiently expressed GFP (fluorescence, c). Scale bar is 20 μm. d) The spontaneous activity of the neurons in panel a/b were recorded optically at 500 Hz using RhoVR 1. d) The activity of each neuron (1–5, panel a) is displayed as a trace of fluorescence intensity vs. time. The boxed regions in panel d are shown on an expanded scale in part e. Asterisks indicate traces expanded in panel f.
