
Figure 2.
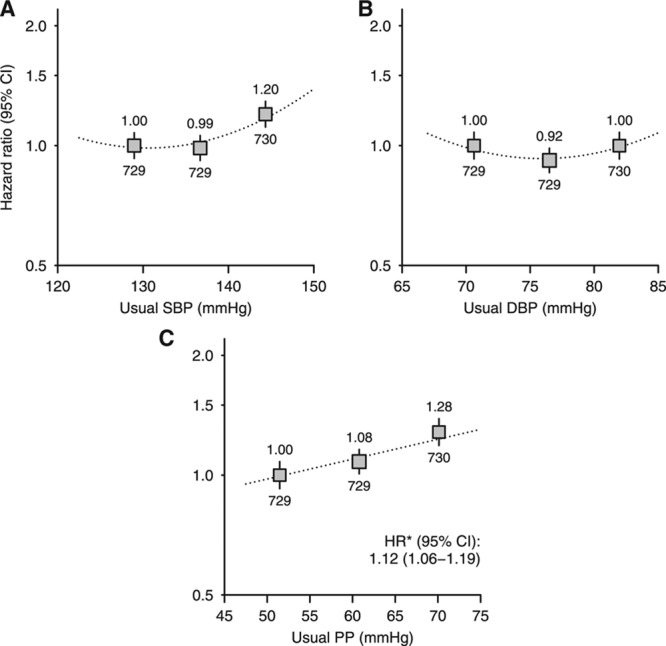
Association between (A) systolic blood pressure (SBP), (B) diastolic blood pressure (DBP), and (C) pulse pressure (PP) and cardiovascular events overall. For each plot, categories of blood pressure contain similar numbers of events. Hazard ratios (HRs) adjusted for age, sex, ethnicity, country, education, smoking status, previous cardiovascular disease, previous diabetes mellitus, estimated glomerular filtration rate, renal replacement therapy status, body mass index, and treatment allocation are quoted (above squares) with numbers of events (below). Exclusions as per Table.*HRs per 10 mm Hg higher usual blood pressure are presented for associations where there is no evidence of deviation from a loglinear relationship. CI indicates confidence interval.