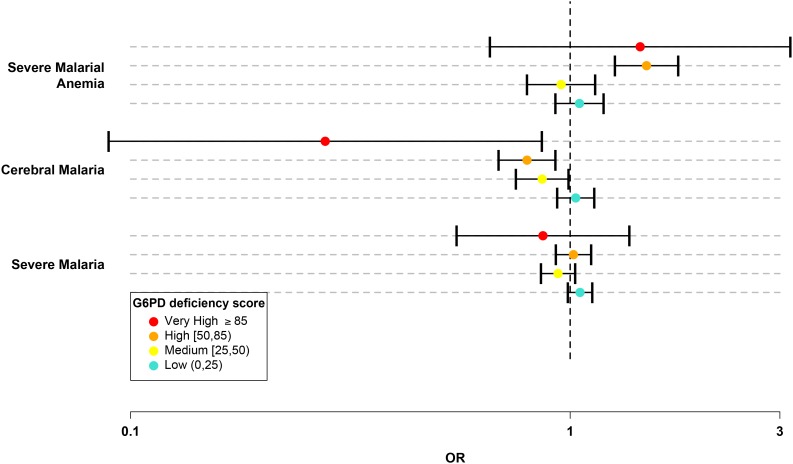
Figure 2. G6PD deficiency score forest plot.
Forest plots showing 95% confidence intervals for the effect of each category of G6PDd score on all severe malaria and on two sub-phenotypes, cerebral malaria and severe malarial anaemia. Results are shown for all individuals across all sites combined and are adjusted for the sickle-cell trait, ethnicity and sex. See Table 6 for details and Supplementary files 1H–J for results at all sites for males, females and all individuals combined.
DOI: http://dx.doi.org/10.7554/eLife.15085.014

