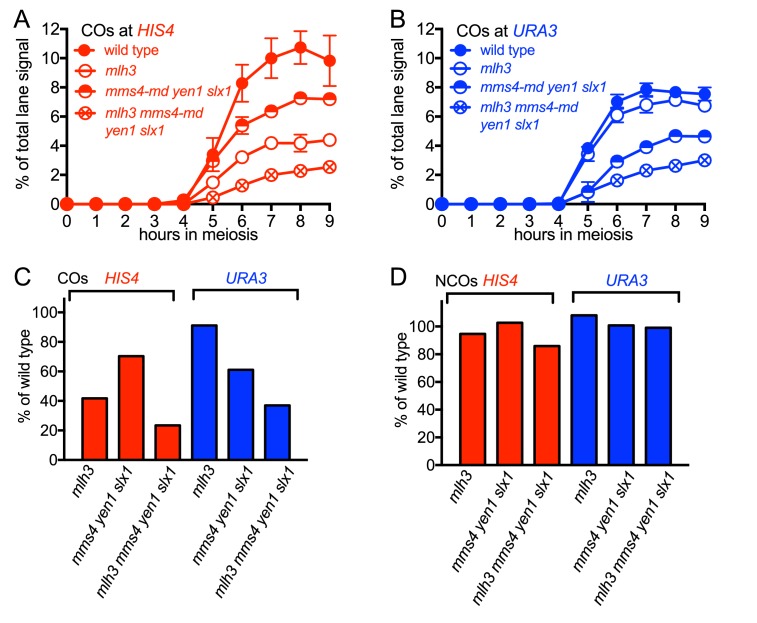
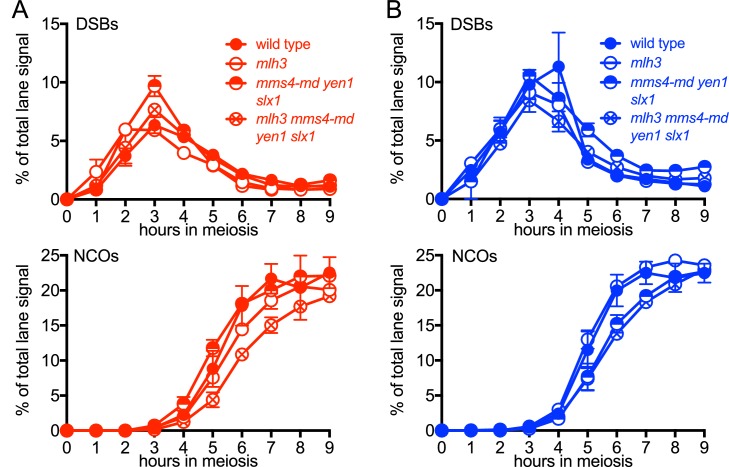
Figure 3. Different resolvase-dependence of crossover formation at the two insert loci.
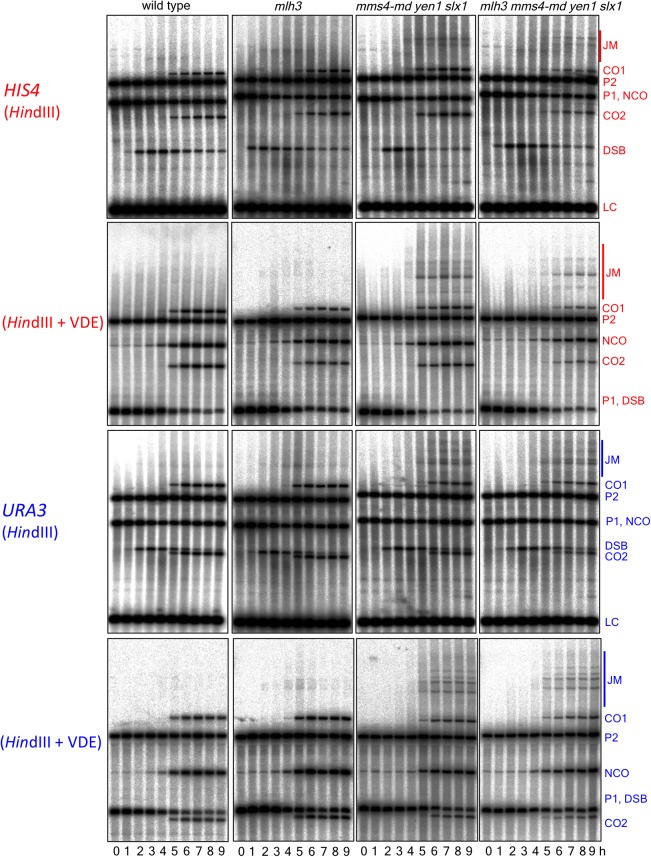
(A) Crossover frequencies (average of CO1 and CO2) measured as in Figure 2C from HIS4 insert-containing mutants lacking MutLγ (mlh3), structure-selective nucleases (mms4-md yen1 slx1) or both resolvase activities (mlh3 mms4-md yen1 slx1). (B) Crossover frequencies in URA3 insert-containing strains, measured as in panel A. Values are the average of two independent experiments; error bars represent range. (C) Final crossover levels (average of 8 and 9 hr values for two independent experiments), expressed as percent of wild type. Note that, in mlh3 mutants, crossovers in HIS4 inserts are reduced by nearly 60%, while crossovers in URA3 inserts are reduced by less than 10%. (D) Final noncrossover levels, calculated as in C, expressed as percent of wild type. Representative Southern blots are in Figure 3—figure supplement 2.


