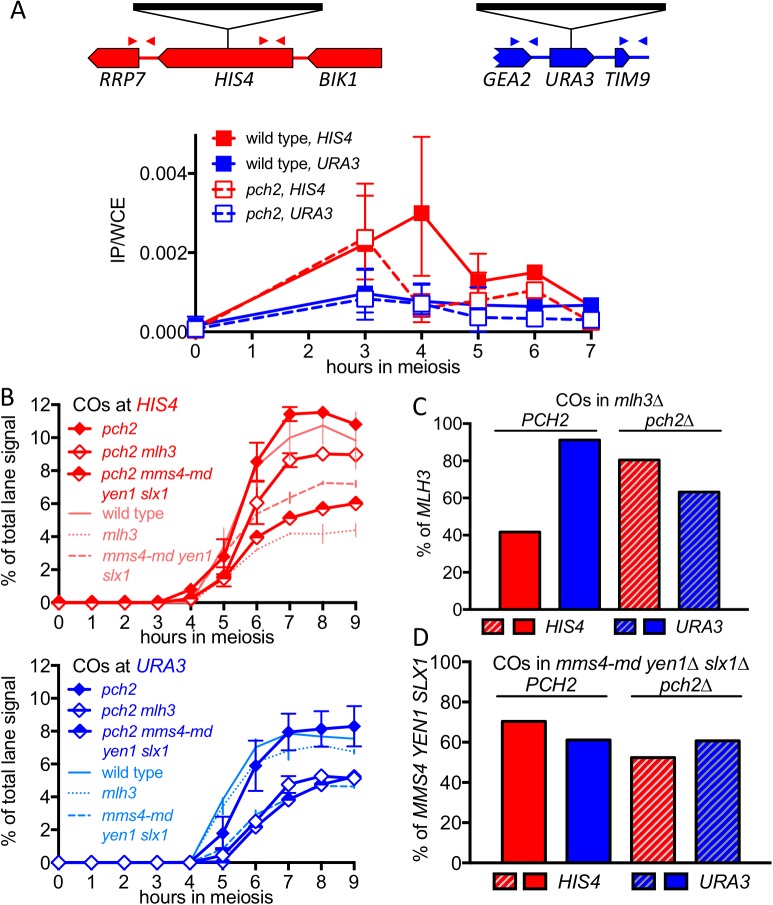
Figure 4. pch2∆ mutants display altered Hop1 occupancy and crossover MutLγ-dependence.
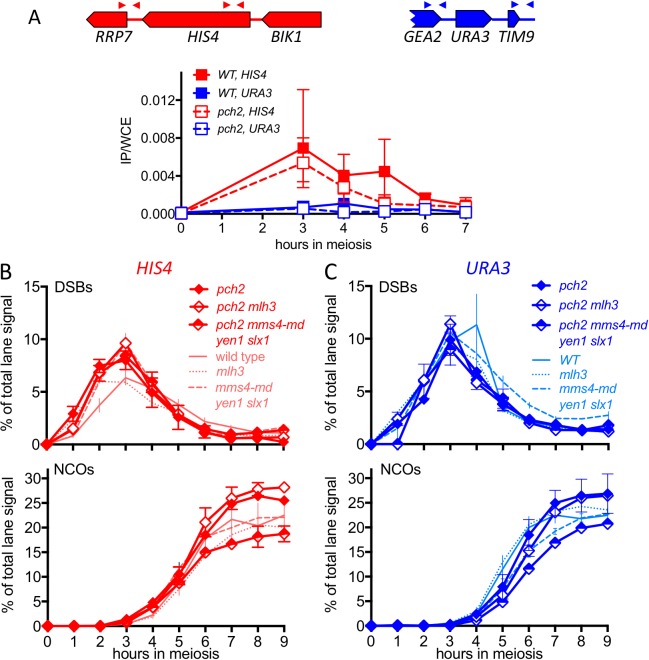
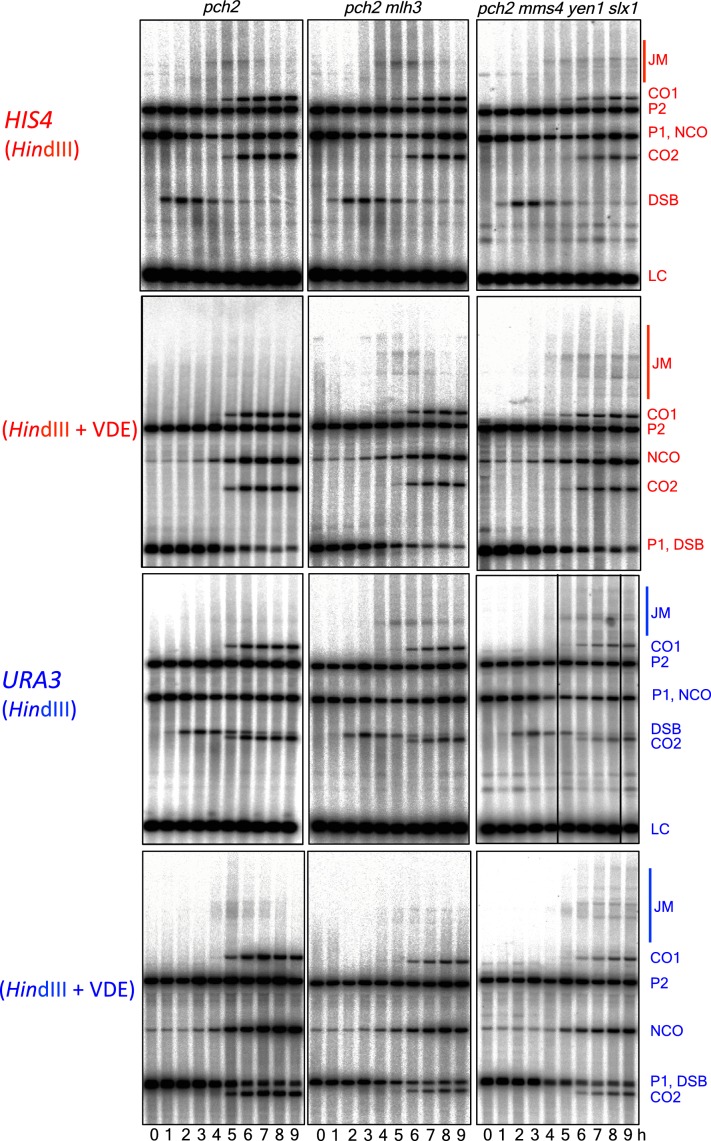
(A) Hop1 occupancy at insert loci, determined by chromatin immunoprecipitation and quantitative PCR. Top—cartoon of insert loci, showing the location of primer pairs used. Bottom—relative Hop1 occupancy, expressed as the average ratio of immunoprecipitate/input extract for both primer pairs (see Materials and methods for details). Values are the average of two independent experiments; error bars represent range. (B) VDE-initiated CO frequencies measured as in Figure 2C at HIS4 (top) and URA3 (bottom) in pch2∆ (solid diamonds), pch2∆ mlh3∆ (open diamonds), and pch2∆ mms4-md yen1 slx1 (half-filled diamonds) mutants. Crossovers from wild type (solid line), mlh3∆ (dotted line) and mms4-md yen1 slx1mutants (dashed line) from Figure 3 are shown for comparison. Values are from two independent experiments; error bars represent range. Representative Southern blots are in Figure 4—figure supplement 2. (C) Extent of CO reduction in mlh3∆ mutants, relative to corresponding MLH3 strains. (D) Extent of CO reduction in mms4-md yen1 slx1 (ssn) mutants, relative to corresponding MMS4 YEN1 SLX1 strains. For both (C) and (D), PCH2 genotype is indicated at the top; values are calculated as in Figure 3C.


