. 2016 Nov 18;5:e19669. doi: 10.7554/eLife.19669

Figure 5. VDE-initiated COs are reduced and are MutLγ-independent in the absence of Spo11 activity.

(A) VDE-initiated crossover frequencies, measured as in Figure 2C in spo11-Y135F strains (dark solid lines) in inserts at HIS4 (red) and at URA3 (blue). Data from the corresponding SPO11 strains (dotted lines, from Figure 2C) are presented for comparison. (B) COs in HIS4 inserts in spo11 strains that are otherwise wild-type (spo11) or lack either Mutlγ or structure-selective nucleases. (C) As in B, but with inserts at URA3. Values are from two independent experiments; error bars represent range. Representative Southern blots are in Figure 5—figure supplement 2.

DOI: http://dx.doi.org/10.7554/eLife.19669.013

Figure 5.

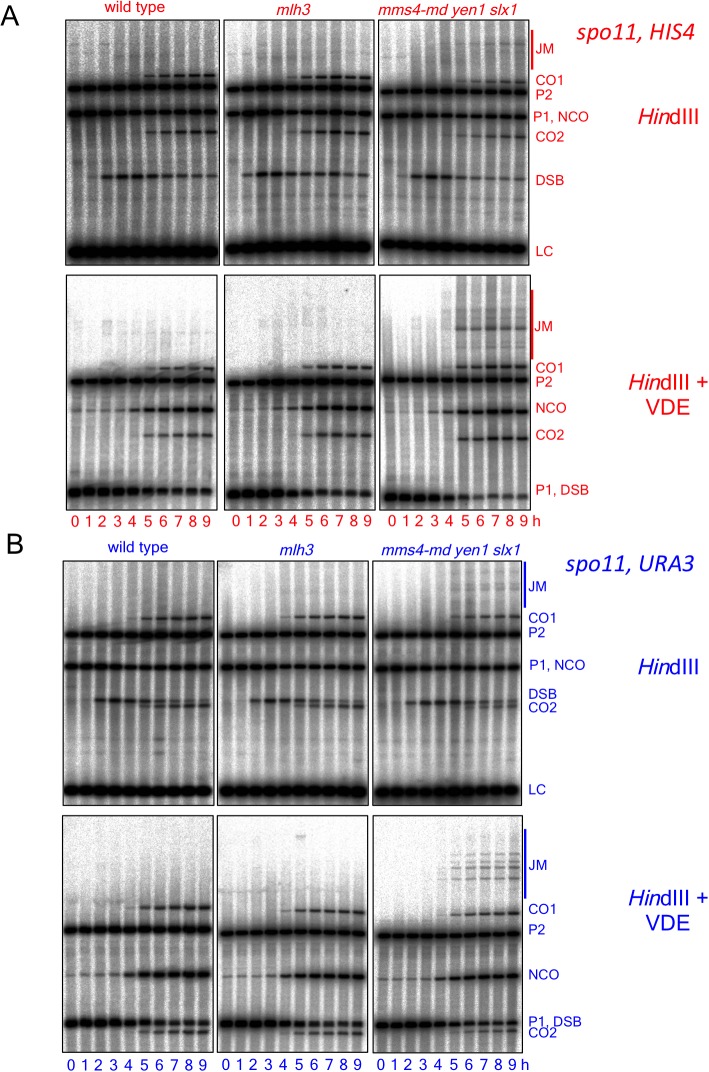
Figure 5—figure supplement 1. DSBs and recombinant products in spo11 strains.

Figure 5—figure supplement 1.

(A) Cumulative DSB levels, expressed as loss of the VRS-containing insert, calculated as in Figure 2A. (B) Relative recovery of recombination products, calculated as in Figure 2—figure supplement 1B. (C) VDE-DSB frequencies, as in Figure 2B. (D) NCO frequencies, as in Figure 2C. In all four panels, solid lines denote values from spo11 strains; values from wild type (dotted lines, from Figure 2 and Figure 2—figure supplement 1) are presented for comparison. (E) DSB (top) and NCO (bottom) frequencies in spo11-Y135F strains with inserts at HIS4. (F) DSB (top) and NCO (bottom) levels in spo11-Y135F strains with inserts at URA3. For all panels, values are from two independent experiments; error bars represent range. Representative Southern blots are in Figure 5—figure supplement 2.
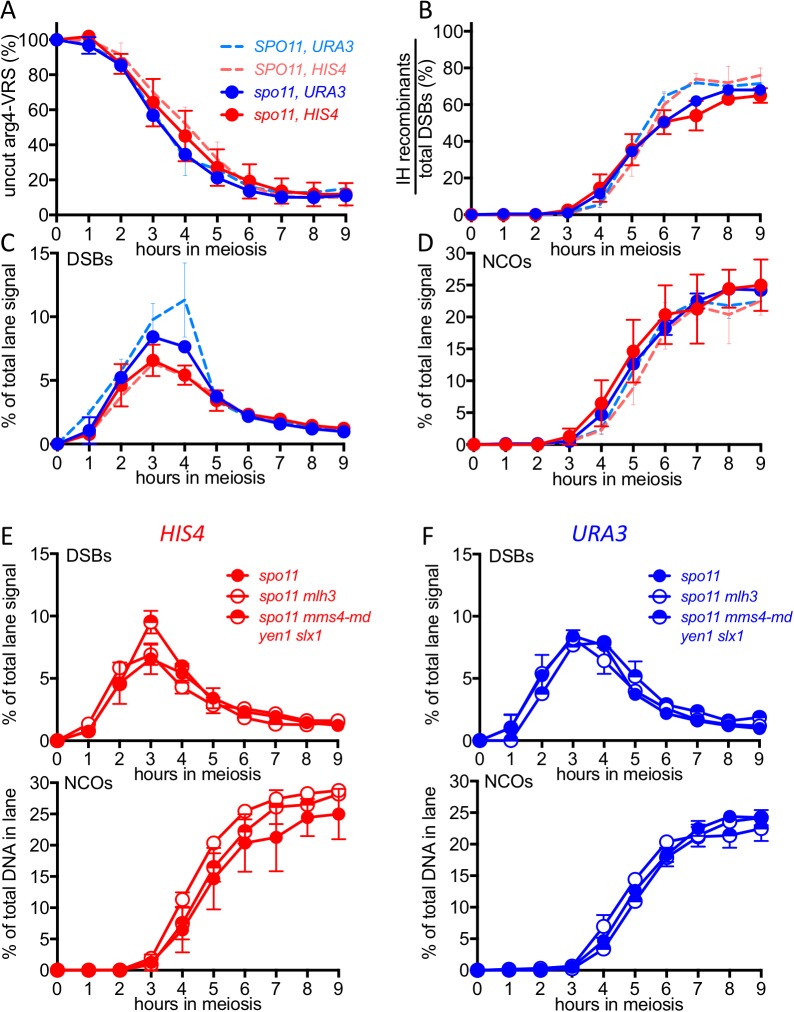
Figure 5—figure supplement 2. Southern blots of HindIII and HindIII-VDE digests of DNA from spo11 strains with inserts at HIS4 (top) and at URA3 (bottom).

Figure 5—figure supplement 2.

Gel labels are as in Figure 1; JM—joint molecule recombination intermediates.