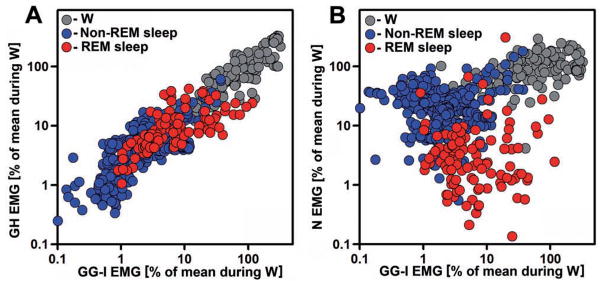
Fig. 3.
Distribution of GG-I, GH and N EMG levels relative to each other during different behavioral states. GG-I, GH and N EMG levels were normalized by their mean levels during wakefulness (W), color-coded by behavioral state, and their root mean square (RMS) values plotted for all 720 successive 10 s intervals of a 2 h recording of undisturbed behavior. GG-I and GH activity levels are more closely correlated with each other across all behavioral states (A) than GG-I activity is with N activity (B). Characteristic for the GG-I vs. N scatter plot is the upward shift of N EMG levels relative to GG-I EMG levels for many epochs during non-REM sleep (blue symbols) and a major downward shift of N EMG levels relative to GG-I EMG levels during REM sleep (red symbols). The GG-I and GH recording sites for this example correspond to animal #18 in Fig. 1.

