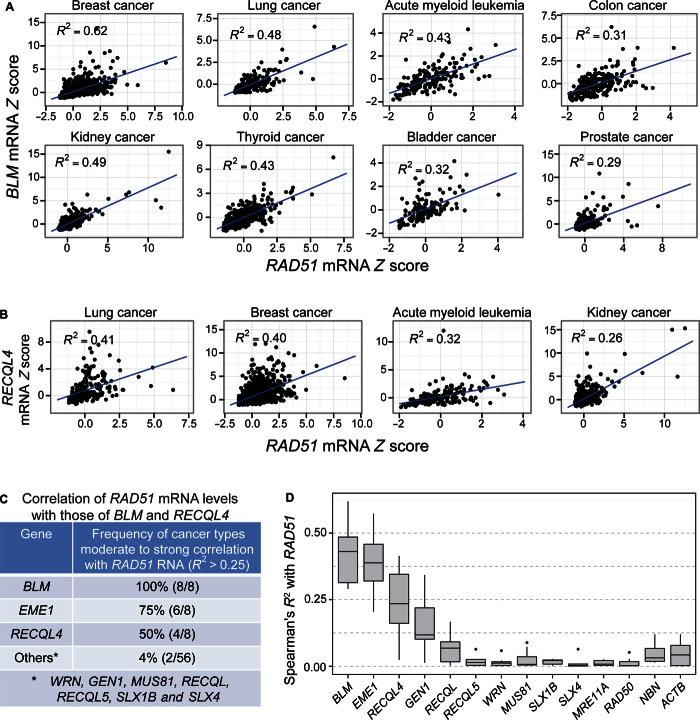
Fig. 7. Increased BLM and RECLQ4 mRNA in RAD51-overexpressing human cancers of the eight, and four of the eight, most common cancer types, respectively.
Spearman’s rank correlation analyses of data from cBioPortal (88, 89), per Materials and Methods. Each data point represents the mRNA level in one patient sample relative to the reference population (Z score; Materials and Methods). Data from 129 to 1100 patient samples were analyzed per cancer type (table S1). (A) Increased BLM mRNA levels (y axis, Z scores) correlated with increased RAD51 mRNA (x axis, Z scores) in eight of eight of the most common cancer types (R2 > 0.25; P ≤ 6.23 × 10⁻²¹, Spearman’s rank correlation analysis). (B) Increased RECLQ4 mRNA levels (y axis, Z scores) correlated with increased RAD51 mRNA (x axis, Z scores) in four of eight of the most common cancer types (R2 > 0.25; P ≤ 2.07 × 10⁻⁸, Spearman’s rank correlation analysis). (C) Summary: correlation of increased RAD51 mRNA levels with increased levels of BLM and RECLQ4 RecQ orthologs, EME1 HJ resolution protein, and other RecQ orthologs and resolution proteins in patient tumor data of the eight most common cancers (numbers in parentheses, number of common cancers of the eight most common types with correlation). mRNA Spearman’s correlation coefficient calculated between these and other human RecQ orthologs and other HJ resolvases with RAD51 and with each other among the eight most common cancers is summarized in table S1 (R2 > 0.25 indicates moderate correlation; see table S1 for details). (D) Summary of Spearman’s R2 values for cancer RNAs of genes correlated with RAD51 overexpression (R2 > 0.25 for moderate correlation) and control genes poorly correlated or uncorrelated with RAD51 overexpression (for example, ACTB, which encodes a subunit of actin).

