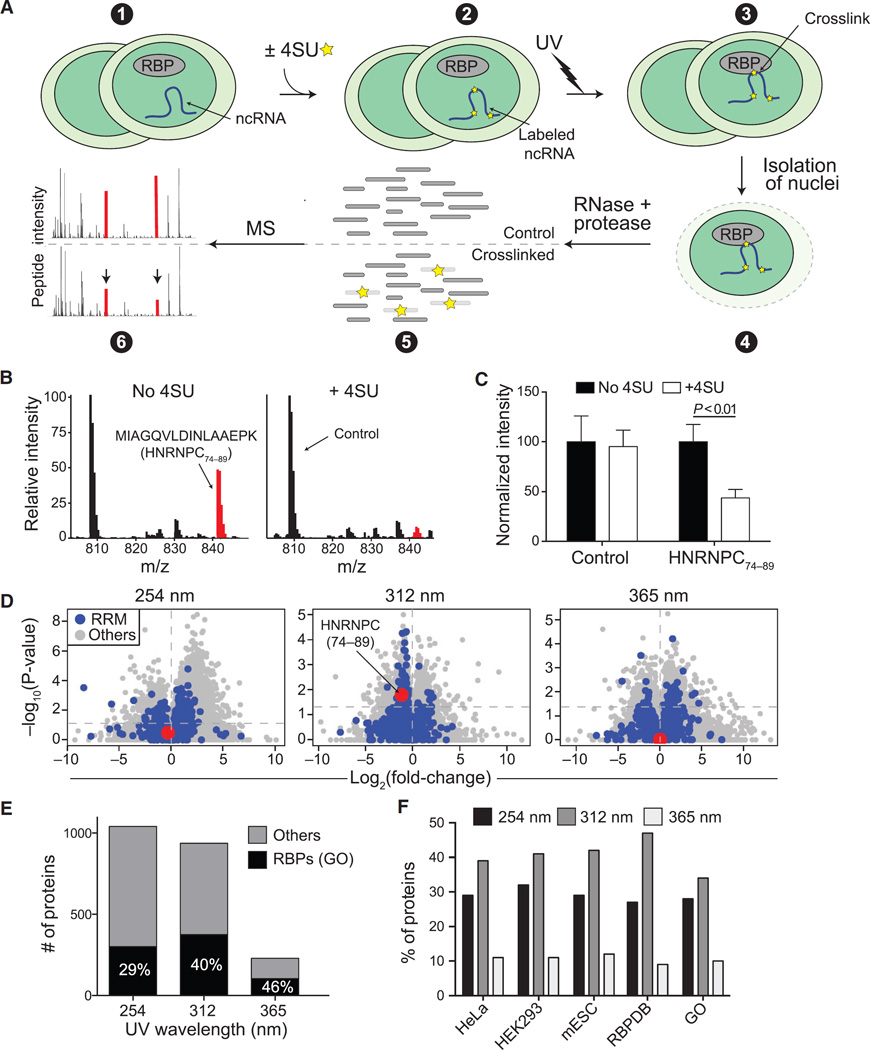
Figure 1. Development and Optimization of RBR-ID.
(A) Mouse ESCs were pulsed with 4SU or not treated (1 and 2) and irradiated with different UV wavelengths (3). We isolated nuclei (4) and digested the crosslinked extracts with protease and RNase, producing a mixture of crosslinked and uncrosslinked peptides (5). Covalent crosslinks to RNA alters the peptide mass, and the mass spectrum of the corresponding uncrosslinked peptide decreases in intensity (6; red peaks).
(B) Example averaged spectra from comparable retention time windows from untreated (left) and 4SU-treated ESCs (right). UV (312 nm) crosslinking caused decreased intensity of the highlighted spectrum in the 4SU sample.
(C) Quantification of the extracted chromatogram for the control and HNRNPC peptides highlighted in (B). Bars indicate the average of the peak intensities normalized to the untreated sample (no 4SU) in six replicates + SEM.
(D) Volcano plots showing log-fold changes in peptide intensities on the x axis and p values on the y axis for ±UV (254 nm) and ±4SU (312 and 365 nm). Peptides overlapping annotated RRM domains are in blue. The RNA-binding peptide from HNRNPC is highlighted in red.
(E) Number of proteins with consistently (p < 0.05) depleted peptides and annotated as RBPs in the GO database (black) or not (gray).
(F) Percentage of known RBPs according to the indicated studies and databases that were identified using different UV wavelengths for the crosslink.
See also Figure S1.

