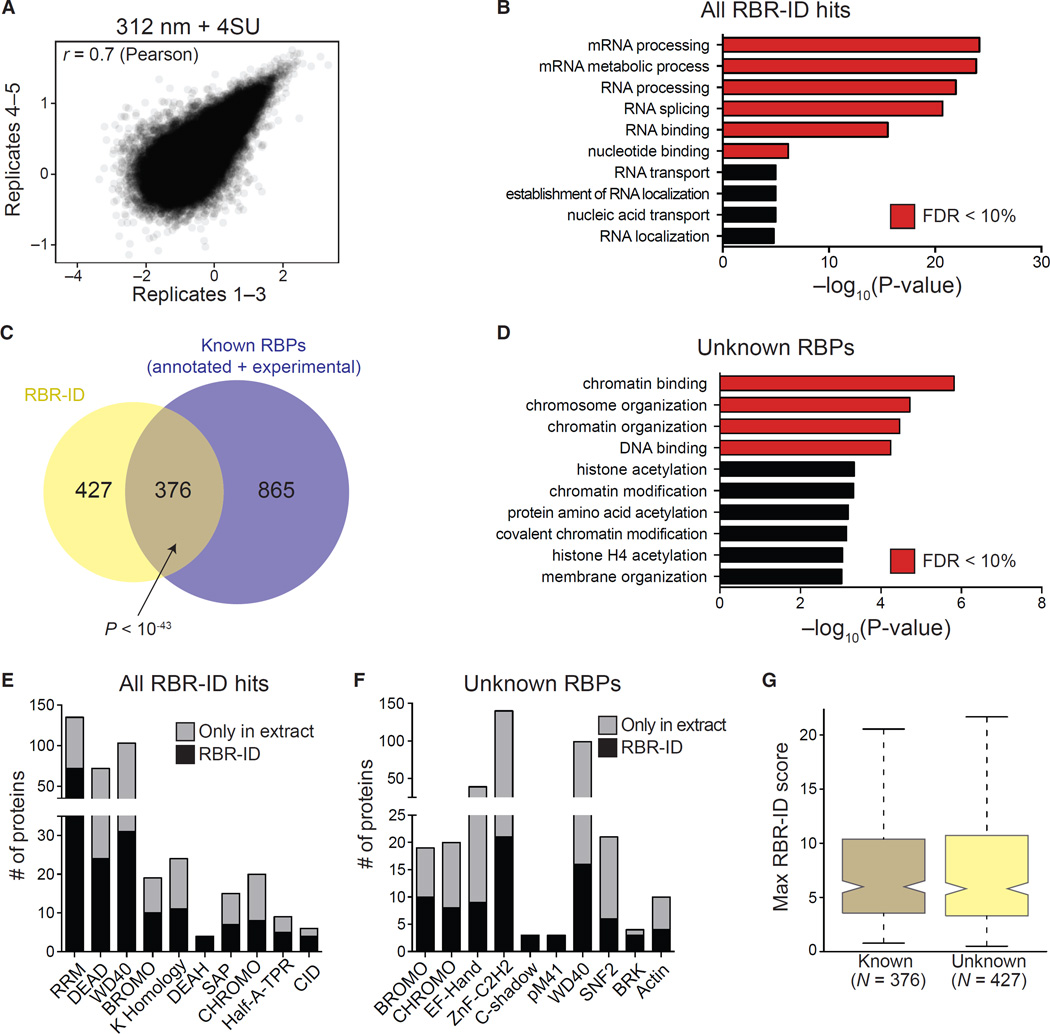
Figure 2. Protein-Level Analyses of Proteins Identified by RBR-ID.
(A) Scatterplot showing log-converted and normalized average intensities for peptides from biological replicates 1–3 and the additional replicates 4 and 5.
(B) Top ten enriched GO terms (biological process and molecular function) for primary RBR-ID protein hits. p values are plotted on the x axis, and terms with false discovery rate (FDR) < 10% are shown in red.
(C) Overlap of RBR-ID protein hits and all known RBPs, both experimentally identified and annotated in databases. p value is from the hypergeometric distribution.
(D) Top ten enriched GO terms as in (B) but only for the RBR-ID protein hits not found in the set of already known RBPs.
(E and F) Top ten non-redundant protein domains enriched in the primary RBR-ID protein hits (E) or only in the unknown RBP set (F). The black section of the stacked bar plots indicates the number of proteins containing the domain and found in the primary RBR-ID candidate list; the gray section indicates the number of proteins not in the RBR-ID list but detected by MS in the ESC nuclear extract.
(G) Tukey boxplot for the distribution of maximum RBR-ID scores per protein comparing known RBPs and unknown putative RBPs from (C).
See also Tables S1, S2, S3, S4, S5, S6, and S7 and Figure S2.

