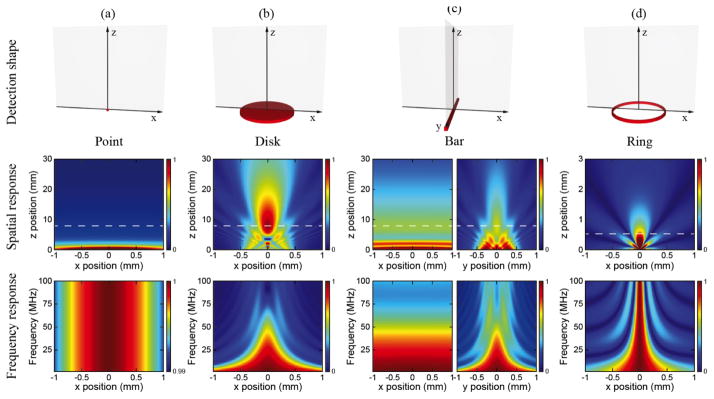
Fig. 8.
Simulated angular distribution of ultrasonic frequency detection sensitivities with different optical interrogation shapes or resonator geometries: (a) point shape; (b) 1-mm disk shape; (c) 1-mm bar shape; and (d) 60-μm ring shape. Top panels: schematics of different detection geometries. Middle panels: spatial distributions of ultrasonic amplitude detection sensitivities at 50 MHz of corresponding geometries in the top row. Bottom panels: corresponding spatial distributions of ultrasonic frequency detection sensitivities along highlighted locations in the middle panels which were taken at z=8 mm for point, disk and bar shapes and z=0.5 mm for ring shape.

