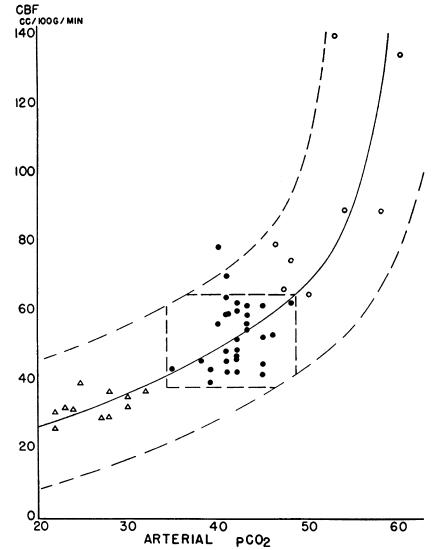
Figure 3.
The relationship between cerebral blood flow and arterial CO2 tension. Arterial CO2 tension was varied from the normal (filled circles) by hyperventilation (triangles) or by inhalation of 5–7% CO2 (open circles). The broken curves bound 98% of the observations while the central polygon encloses 94% of the normal values. Figure reprinted and legend adapted from ref. 8.

