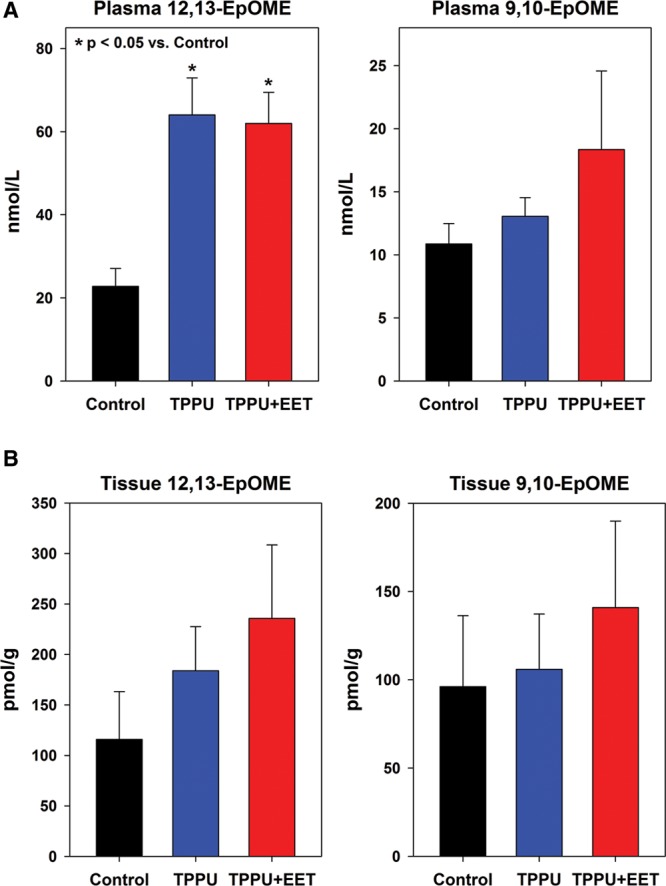
Fig. 3.

Levels of linoleic acid–derived EpOMEs measured in plasma and tissue at 2 weeks after transplantation. Shown are values (mean + SEM) measured in plasma (A) and tissue biopsies (B) for individual regioisomers 12,-13-EpOME (left plot) and 9,10-EpOME (right plot). Statistically significant differences are marked with asterisks (*P < 0.05).
