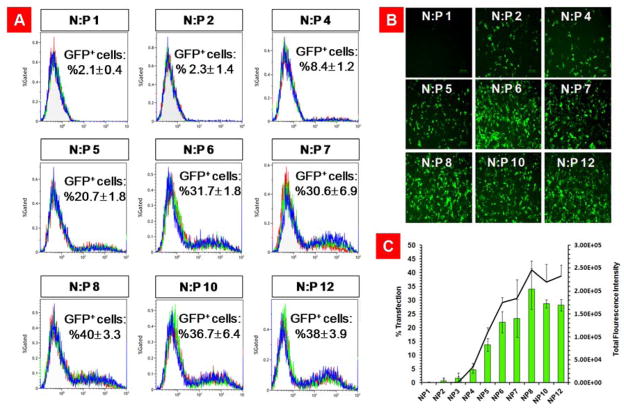
Figure 3.
Evaluation of transfection efficiency of THG/pEGFP nanoparticles at N:P ratios of 1 to 12. A) Flowcytometry graphs showing the percentage of GFP positive cells. Each graph is an overlay of three independent repeats. B) Fluorescent microscopy images of the transfected SKOV-3 cells illustrating the extent of gene expression. C) A bar chart that quantitatively demonstrates the percentage of transfected cells and total green fluorescent protein expression. The data are shown as mean±s.d. (n=3).

