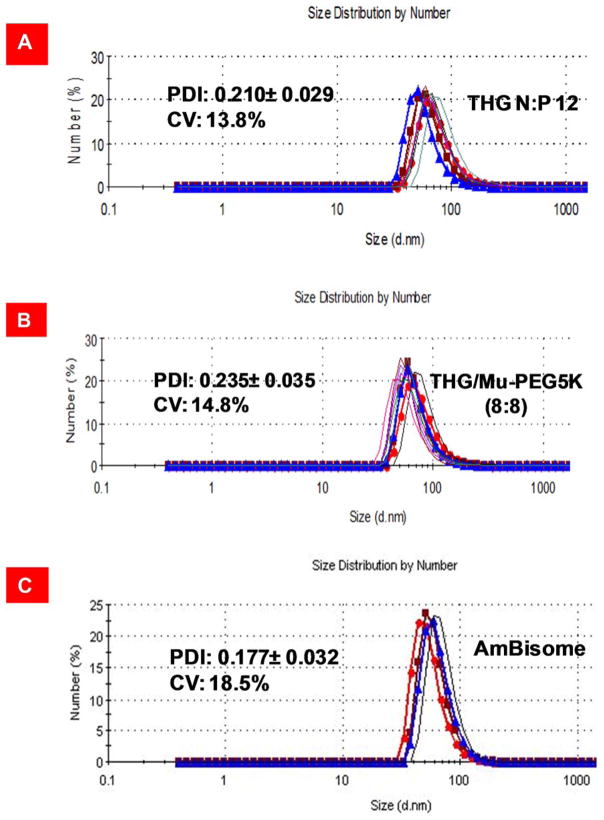
Figure 7.
Polydispersity index analysis and measurement of coefficient of variation. A) Particle size distribution of THG/pEGFP at N:P 12. The data are shown as mean±s.d. (n=10). B) Particle size distribution analysis of nanoparticles formed through complexation of THG/Mu-PEG5K (8:8) at N:P 12 with pEGFP. The data are shown as mean±s.d. (n=10). C) Particle size distribution of Ambisome™. The data for Ambisome™ are shown as mean±s.d. (n=4).

