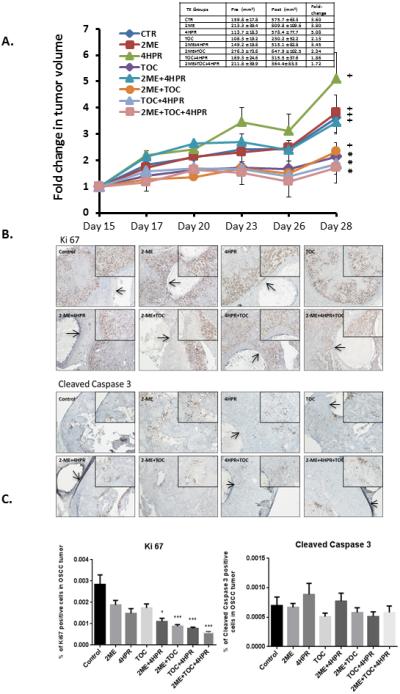
Figure 6.

A. One million SCC2095sc cells (suspended in 100 μl Matrigel) were subcutaneously injected in in flanks of 6 to 7 week old male nude mice (n=6 per treatment group). By day 14 post injection, all mice had palpable and measurable tumors. Treatment began on day 15. Caliper-based tumor measurements were recorded daily and final tumor volumes calculated via tumor volume V= (length × width2) × ½. Treatment groups consisted of: 1) control (PBS injections) + blank (no drug) polylactide co-glycolide (PLGA) implants, 2) 2-methoxyestradiol (2-ME) (1μg/100μl PBS, b.i.d.) + blank PLGA implant, 3) fenretinide (4-HPR) releasing PLGA implant + PBS injections, 4) tocilizumab (TOC) q.d. (0.3μg/100μl PBS) + PLGA blank implant, 5) 2-ME (1μg/100μl PBS, b.i.d.) + 4-HPR releasing PLGA implant, 6) 2-ME (1μg/100μl PBS, b.i.d.) + TOC q.d. (0.3μg/100μl PBS) + blank PLGA implant, 7) TOC q.d. (0.3μg/100μl PBS) + 4-HPR releasing PLGA implant, 8) 2-ME (1μg/100μl PBS, b.i.d.) + TOC q.d. (0.3μg/100μl PBS) + 4-HPR releasing PLGA implant. In previous studies that employed younger mice tumors of varying sizes were disbursed among all treatment groups. Due to the older age of mice >6 weeks and the accompanying cage aggression tumor size distribution was not feasible in these studies. As a result, mean tumor volumes varied appreciably among treatment groups (See Table insert Figure 6). PLGA implants (trocar placement) and injections were placed in the center of the tumor. Fluid dispersion throughout tumor was noted during injections. At day 28 post OSCC xenograft placement the mice were sacrificed, OSCC tumors along with lung and liver tissues and sera were harvested (for PK and histologic analyses). Our data show three groups i.e. TOC, TOC + 4-HPR, and triple treatment (TOC+2-ME+4-HPR) were the only treatments that prevented a significant increase in tumor volume (paired t test). Provided the discrepancy in pretreatment tumor volumes (TOC the lowest, triple treatment second highest with its mean nearly two fold higher than TOC mean), the TOC + 2-ME + 4-HPR data are especially creditable.
Figure 6. B. Ki-67 and cleaved caspase 3 immunohistochemical stains were conducted to assess qualitative treatment effects on tumor cells’ proliferation and apoptosis. IHC images representative of all of the groups are presented. The PLGA implants are visible as a clear cylindrical object in every photomicrograph except the TOC and 2-ME + TOC treatment. To facilitate PLGA implant recognition, arrows have been placed within the implants. Both the Ki-67 and caspase 3 stains are located within the nucleus. Qualitative Ki67 staining assessment was most apparent at the periphery of the tumors in all groups. In contrast to the abundant Ki-67 staining, cleaved caspase 3 was not nearly as prominent.
Figure 6.C. Image analysis revealed that all treatments suppressed tumor cell proliferation relative to the untreated tumor. Furthermore, significant inhibition of proliferation (as assessed by % of tumor cells demonstrating Ki-67 labeling) was seen in these groups: 2-ME+4-HPR+TOC, TOC+4-HPR, 2-ME+TOC (all p<0.001) and 2-ME+4-HPR (p<0.05) Kruskal Wallis with Dunns’ Multiple Comparison post hoc test. Although cleaved caspase 3 nuclear staining was present, none of the treatments showed any significant effects relative to the matched control tumors. Image analysis did not reveal any inter-group differences with regard to caspase 3 labeling. (Image scale 4X and 10X for smaller and larger photomicrographs, respectively.).
