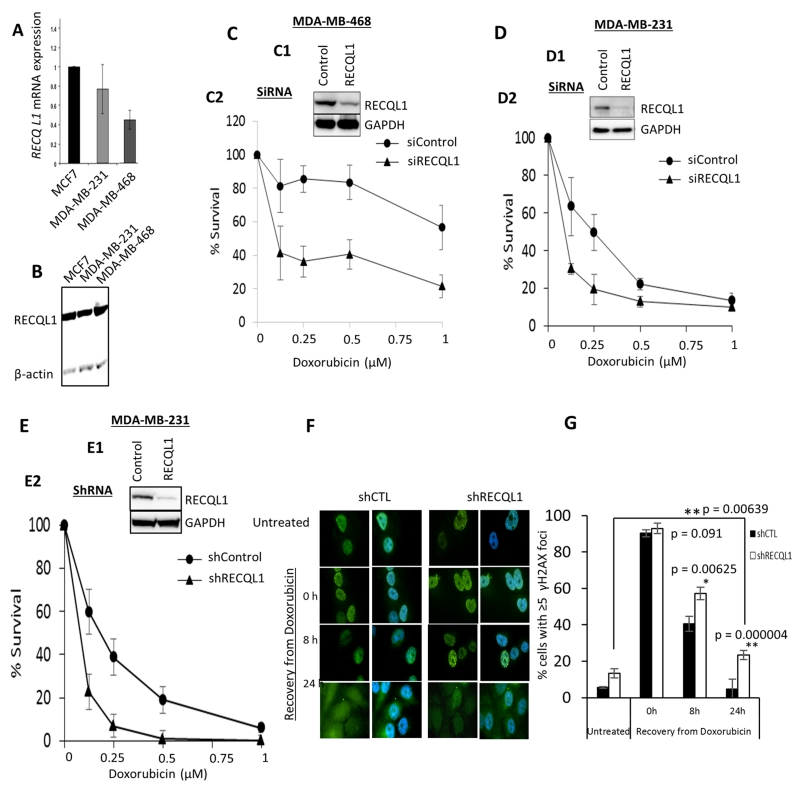
Figure 3. RECQL1 depletion and doxorubicin sensitivity in breast cancer cell lines.
A. RECQL1 mRNA expression in MCF-7, MDA-MB-231 and MDA-MB-468 breast cancer cell lines. B. RECQL1 protein level in MCF-7, MDA-MB-231 and MDA-MB-468 breast cancer cell lines. C. Transient RECQL1 depletion by siRNA (C1) and doxorubicin sensitivity in MDA-MB-468 (C2) [The graph shows the cellular surviving fractions measured at different doses of doxorubicin treatment in control and RECQL1-depleted cells. Surviving fraction values are the mean ± SEM from three independent experiments]. D. Transient RECQL1 depletion by siRNA (D1) and doxorubicin sensitivity in MDA-MB-231 (D2) [The graph shows the cellular surviving fractions measured at different doses of doxorubicin treatment in control and RECQL1-depleted cells. Surviving fraction values are the mean ± SEM from three independent experiments]. E. Stable RECQL1 depletion by shRNA (E1) and doxorubicin sensitivity in MDA-MB-231 (E2) [The graph shows the cellular surviving fractions measured at different doses of doxorubicin treatment in control and RECQL1-depleted cells. Surviving fraction values are the mean ± SEM from three independent experiments]. F. Representative immunofluorescence staining of γH2AX foci (green) and its merge with nuclear DNA stain DAPI (blue) in control and RECQL1-depleted MDA-MB-231 cells is shown here. G. Analysis of γH2AX foci in MDA-MB-231 cells stably transduced with control or RECQL1 shRNA. The percentage of cells exhibiting ≥5 γH2AX foci at indicated time points following recovery from doxorubicin treatment (0.1 μM for 4 h) was determined by immunofluorescence. Quantitative data shown represent the average from two independent experiments with associated SEMs.

