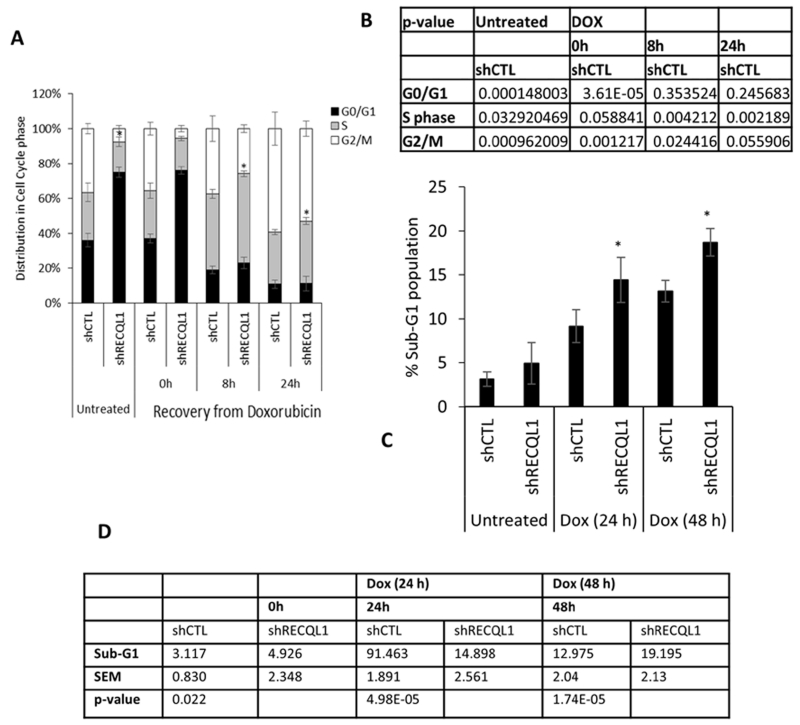
Figure 4. RECQL1 depletion and cell cycle progression.
A. Cell cycle distributions of MDA-MB-231 cells stably transduced with either control or RECQL1 shRNA at the indicated times following recovery from doxorubicin treatment (0.1 μM for 4 h). B. Data shown represent the average from two independent experiments with associated SEMs. Individual p values are summarized as a table here. C. Sub-G1 population in control and RECQL1-depleted MDA-MB-231 cells after doxorubicin treatment (0.1 μM) for indicated time. D. Data shown represent the average from two independent experiments with associated SEMs. Individual p values are summarized as a table here.

