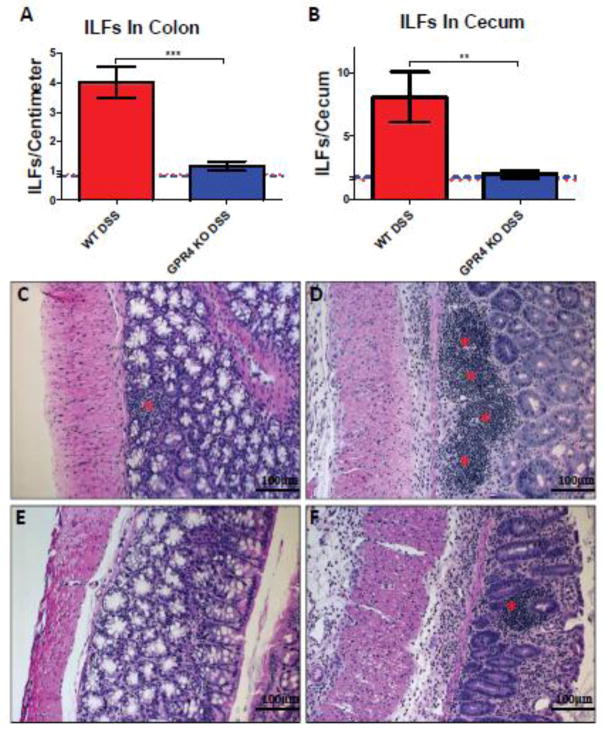
Fig. 4.
Isolated lymphoid follicle (ILF) quantification and H&E staining of ILFs. GPR4 KO DSS mice had reduced ILF number in the colon and cecum when compared to WT-DSS mice. ILF quantification in WT and GPR4 KO (A) colon and (B) cecum tissues. Representative H&E staining of ILFs in (C) WT control (n=12), (D) WT-DSS (n=13), (E) GPR4 KO control (n=12), and (F) GPR4 KO-DSS colons (n=18). Red asterisks indicate representative ILFs in colon tissue. Red and blue dotted lines indicate WT-control and GPR4 KO control ILF quantification, respectively (A–B). Data are presented as mean ± SEM. WT-Control (n=12), WT-DSS (n=13), GPR4 KO control (n=12), and GPR4 KO DSS (n=18) tissues were used for analysis. Statistical analysis was performed using the unpaired t-test between WT-DSS and GPR4 KO-DSS groups. (**P < 0.01, *** P< 0.001)

