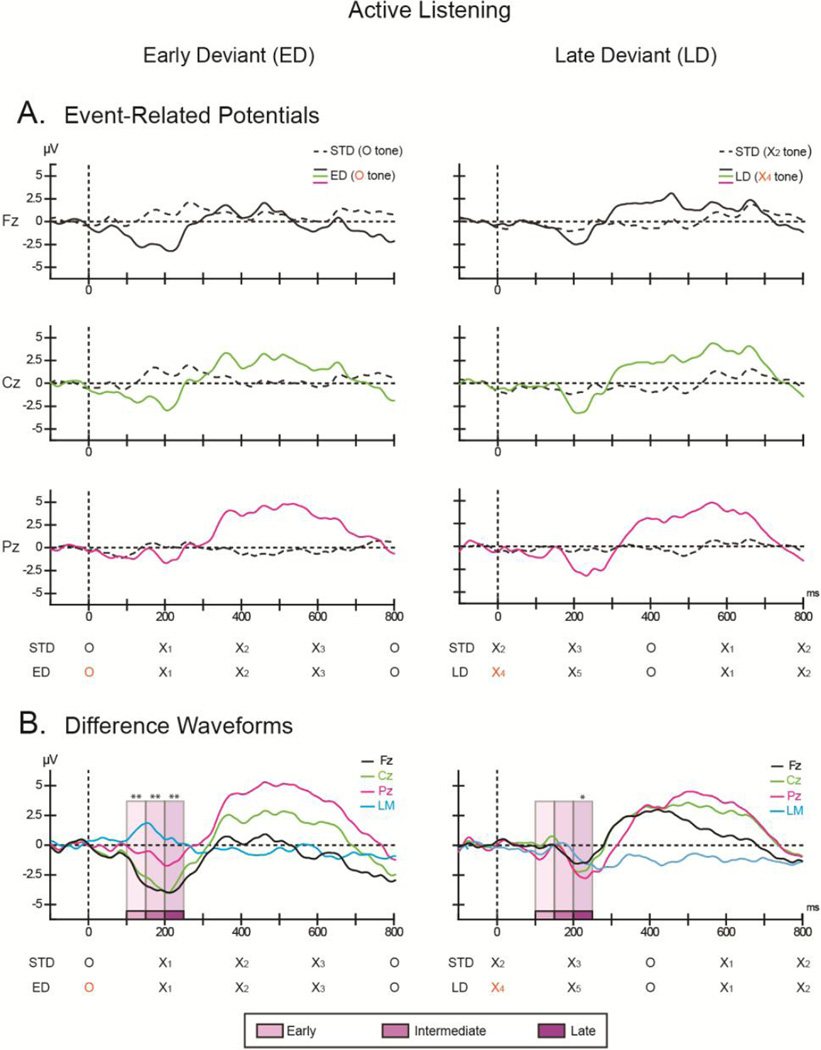
Figure 3. Active listening.
The ordinate displays the amplitude in microvolts and the abscissa displays the timing in milliseconds. (A) Grand-mean ERPs elicited by the early deviant (ED; left column), late deviant (LD; right column), with the standard comparison epoch (dashed black line) overlain at Fz (top row, black solid line), Cz (middle row, green solid line), and Pz (bottom row, pink solid line). (B) Difference waveforms obtained by subtracting the ERPs elicited by the deviant epoch from the ERPs elicited by the corresponding standard epoch for Fz (black, solid line), Cz (green, solid line), and Pz (pink, solid line) are displayed for the early (left column) and late (right column) deviants. The trace from the left mastoid (LM, solid blue line) is overlain to indicate scalp topography. The timing of the X and O tones of the comparison epochs are shown below the horizontal axes. The tone that coincides with the pattern violation is marked in orange. The intervals used for the time course analysis (see text for details) are indicated by shades of purple (early, intermediate, and late time intervals). Significance is denoted (*p< 0.05; **p<0.001).

