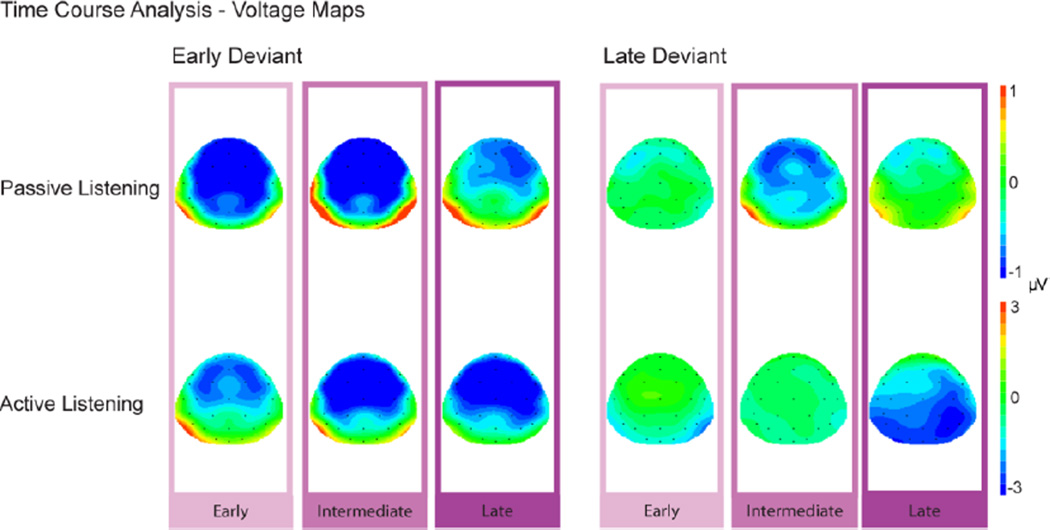
Figure 4. Time Course Analysis.
Scalp voltage maps display the mean voltage within each time window used for the time course analysis: Early (100–150 ms), Intermediate (150–200 ms) and Late (200–250 ms), measured from the grand mean difference waveforms for the early deviant (left column) and the late deviant (right column) for both passive (top row) and active (bottom row) listening conditions. Shades of purple denote the three time intervals and correspond with the time intervals for the difference waveforms displayed in Figures 2B and 3B.

