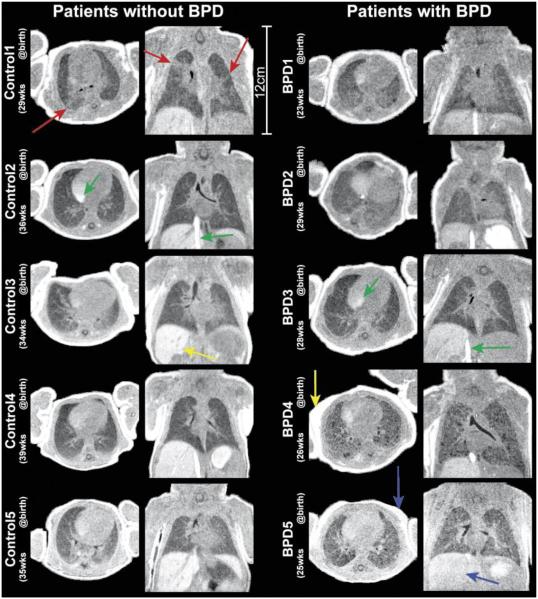
Figure 2.
Views in the axial and coronal planes from 3D UTE image volumes. Patients with no clinical diagnoses of pulmonary disease (left column) are shown alongside patients diagnosed with BPD (right column). Red arrows highlight regions of distinctly heterogeneous parenchymal signal for Control1, a possible indication of sub-clinical pathology potentially linked to the prematurity of birth. Yellow arrows in Control3 and BPD4 highlight the bright liver and fat signal, respectively, associated with heavy T1 weighting obtained with the use of higher flip angles (8°-10°). Blue arrows show reduced contrast between muscle and both fat and liver in BPD5, predicable from the lower flip angle used (5° vs. 8°-10°). Green arrows highlight inflow effects in the right atrium and inferior vena cava.

