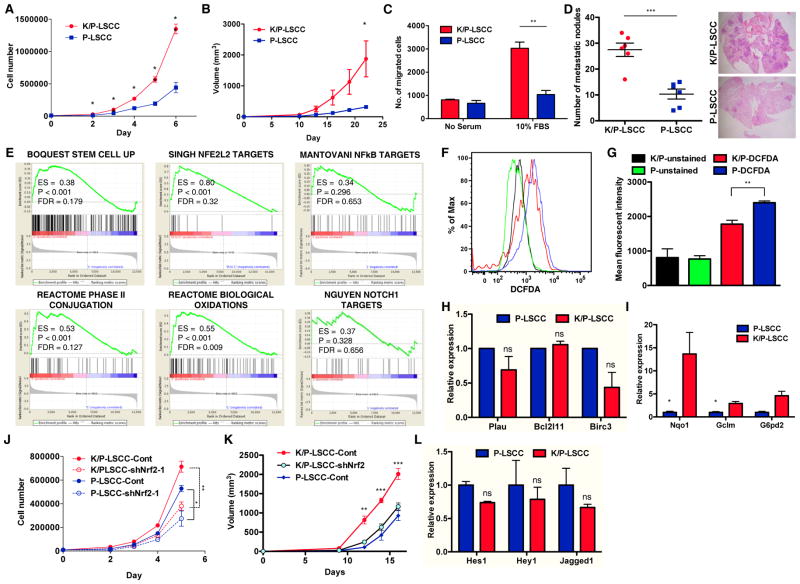
Figure 5. Loss of Keap1 contributes to LSCC pathogenesis by activating the Nrf2-ROS pathway.
(A) In vitro cell proliferation of K/P-LSCC and P-LSCC cells (N=3).
(B) In vivo tumor growth of K/P-LSCC and P-LSCC tumors (N=8).
(C) In vitro cell invasion of K/P-LSCC and P-LSCC cells (N=3).
(D) In vivo lung metastasis of K/P-LSCC and P-LSCC cells (N=6). Microscopic metastatic foci in the lung were counted.
(E) Enrichment plots for highly enriched gene sets from Gene Set Enrichment Analysis of RNA-Seq data (Supplementary Fig. S5A). Gene sets related to stem cells, ROS biology, NFkB and Notch are shown.
(F–G) FACS analysis (F) and bar graph (G) of intracellular ROS levels of K/P-LSCC and P-LSCC cells. ROS levels were measured by DCFDA staining.
(H) Expression of NFkB target genes in K/P-LSCC and P-LSCC cells assayed by qRT-PCR (N=3).
(I) Expression of Nrf2 target genes in K/P-LSCC and P-LSCC cells (N = 3).
(J) In vitro cell proliferation of K/P-LSCC and P-LSCC cells transduced with control or shNrf2-lentivirus (N = 3).
(K) In vivo growth of K/P-LSCC and P-LSCC tumors with and without shNrf2-lentivirus transduction (N=6).
(L) Expression of Notch1 target genes in K/P-LSCC and P-LSCC cells (N=3). All data from (A–D and H–L) are presented as mean ± S.E.M. (* P < 0.05, ** P < 0.01, *** P < 0.001).

