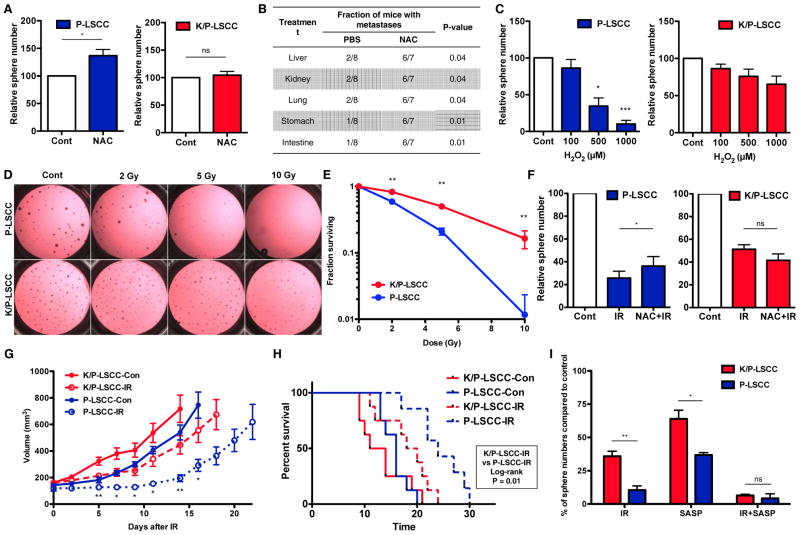
Figure 6. The Keap1-Nrf2 pathway confers LSCCs resistance to oxidative stress and irradiation.
(A) Relative number of P-LSCC and K/P-LSCC tumorspheres treated with vehicle or N-acetylcysteine (NAC; 1 mM) treatment (N=4).
(B) In vivo metastasis of P-LSCC cells treated with PBS or NAC (500 μM) (N=7~8).
(C) Relative number of P-LSCC and K/P-LSCC tumorspheres treated with 0, 100, 500, and 1,000 μM H2O2 treatment (N=5).
(D) Brightfield images of tumorspheres of K/P- and P-LSCCs treated with varying doses of ionizing irradiation.
(E) Clonogenic survival of K/P-LSCC and P-LSCC cells treated with varying doses of ionizing radiation. (N=3).
(F) Relative number of tumorspheres formed by P-LSCC cells pre-treated with vehicle or NAC (500 μM) for 2 hr and then irradiated (5 Gy) (N=4).
(G) In vivo tumor growth curve of K/P-LSCC and P-LSCC tumors with or without irradiation (6 Gy × 1) (N=8). Irradiated K/P-LSCCs and P-LSCCs were compared for tumor growth.
(H) Kaplan-Meier survival curves of K/P- and P-LSCC tumor bearing mice (N=7~8). Tumors were irradiated when after reaching ~120 mm3.
(I) Relative number of P-LSCC and K/P-LSCC tumorspheres with irradiation (IR, 5 Gy) and/or sulfasalazine (SASP, 100 μM) treatment (N=3). All data in (A–I) are presented as mean ± S.E.M. (* P < 0.05, ** P < 0.01, *** P < 0.001).

