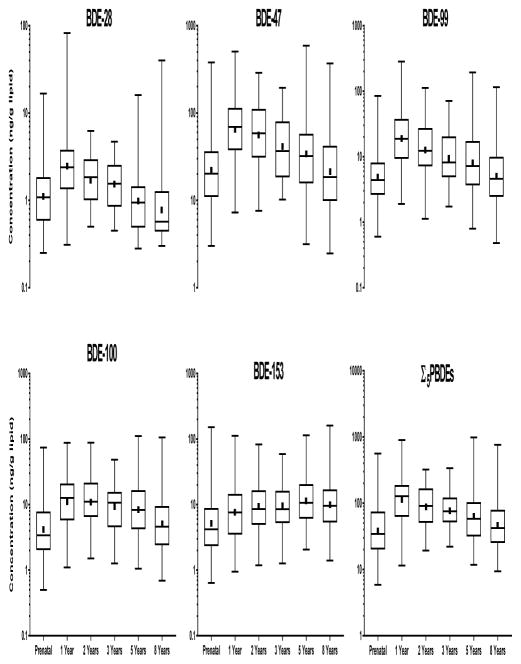
Figure 1.
Serum concentrations of prenatal and postnatal polybrominated diphenyl ethers, HOME Study. Upper and lower lines of the body of the boxplot represent the 25th and 75th percentile, respectively. Median values are indicated by horizontal lines within boxes and solid squares represent geometric means.

