
FIGURE 1.
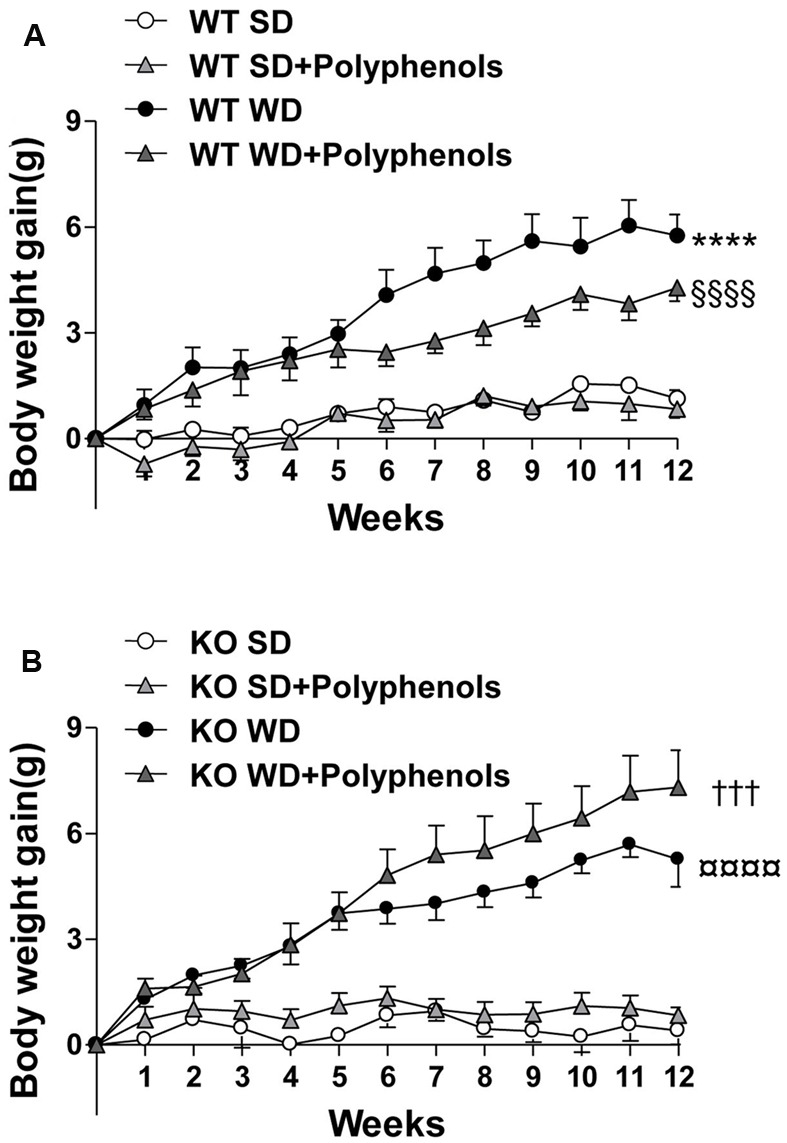
The evolution of (A,B) body weight gain of ERα WT (A) and KO (B) mice receiving normal diet (SD), western diet (WD), or SD and WD containing polyphenols (SD + polyphenols and WD + polyphenols, respectively) during 12 weeks. The body weight was recorded twice a week. The data are expressed as the mean ± SEM. Statistical analyses were performed by repeated measures two-way ANOVA and Holm–Sidak’s post hoc test, ∗∗∗∗P < 0.0001 vs. WT SD, §§§§P < 0.0001vs. WT SD + RWP, †††P < 0.001 vs. KO SD, P < 0.0001 vs. KO SD + RWP.