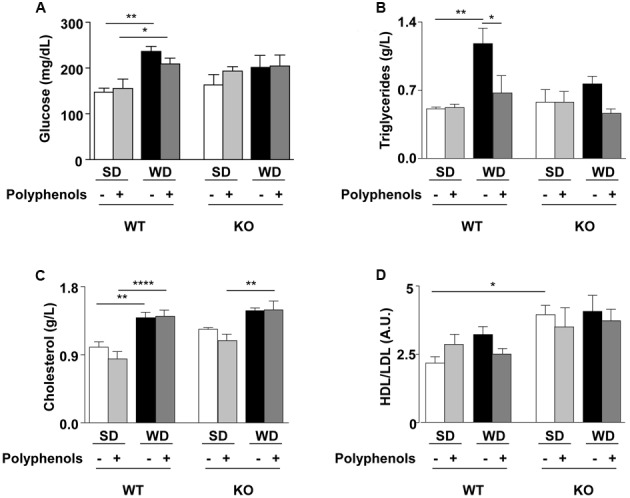
FIGURE 2.

(A) Glucose, (B) triglycerides, (C) cholesterol plasma levels and (D) HDL/LDL ratio of ERα WT and KO mice receiving normal diet (SD), western diet (WD), or SD and WD containing polyphenols (SD + polyphenols and WD + polyphenols, respectively) during 12 weeks. The data are given as the mean ± SEM. Statistical analyses were performed by one-way ANOVA and Holm–Sidak’s post hoc test, ∗P < 0.05, ∗∗P < 0.01, ∗∗∗∗P < 0.0001.
