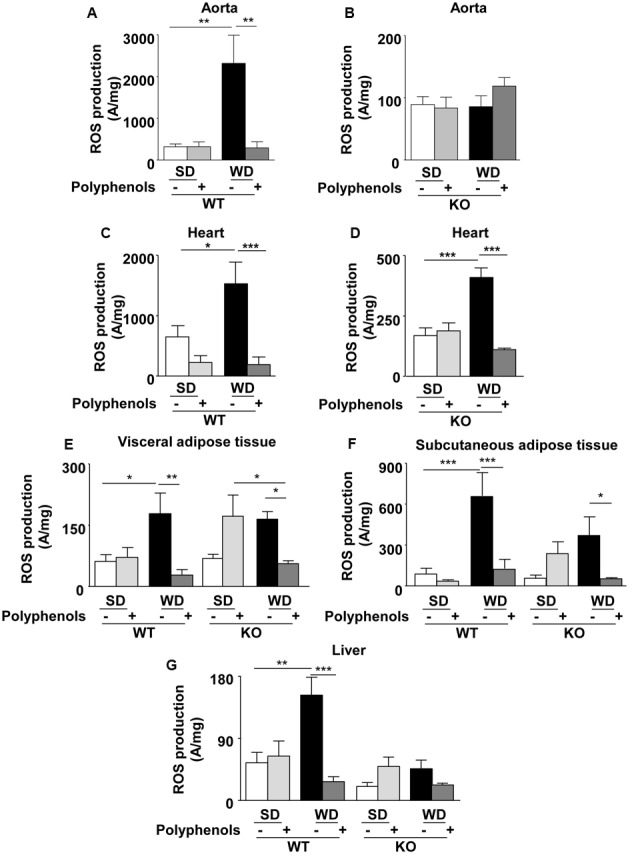
FIGURE 6.

Measurement of in situ ROS productions by electron paramagnetic resonance in aorta (A,B), heart (C,D), visceral (E) and subcutaneous (F) adipose tissue, and liver (G) from ERα WT and KO mice receiving normal diet (SD), western diet (WD), or SD and WD containing polyphenols during 12 weeks. The data are expressed as the mean ± SEM. Statistical analyses were performed by one-way ANOVA and Holm–Sidak’s post hoc test, ∗P < 0.05, ∗∗P < 0.01, ∗∗∗P < 0.001.
