Figure 7.

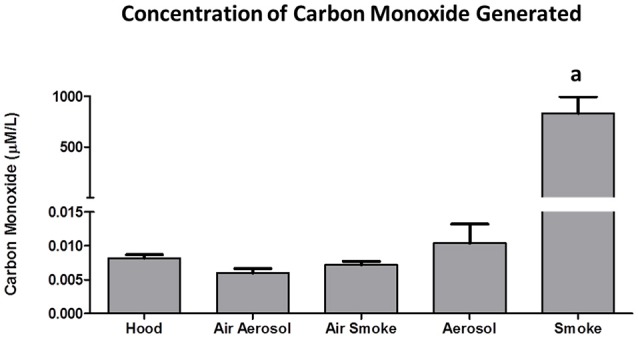
Concentrations of CO collected from 3 puffs of air, ECIG-generated aerosol, and smoke. Data points given as mean ± standard error of the mean. a = p < 0.001.

Concentrations of CO collected from 3 puffs of air, ECIG-generated aerosol, and smoke. Data points given as mean ± standard error of the mean. a = p < 0.001.