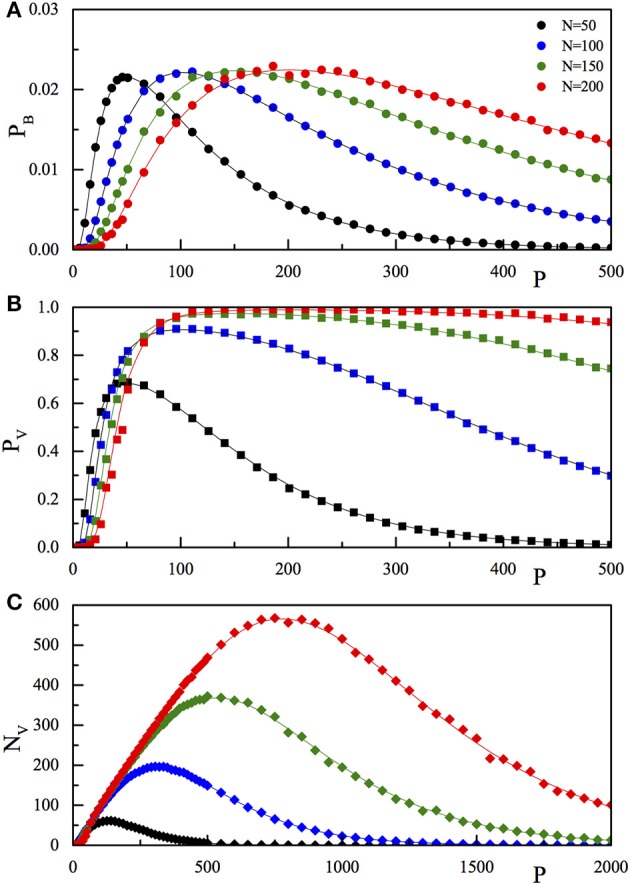
Figure 1.

Comparison of the results of the numerical simulation (pB, full dots A; pV, full squares, B; NV, full diamonds, C) with the corresponding theoretical function (pB, Equation 4; pV, Equation 5; NV, Equation 6) reported as full lines. The three quantities are reported as a function of P for fixed N. The values of N are 50 (black), 100 (blue), 150 (green), and 200 (red). The P range in (C) is extended with respect to (A,B).
