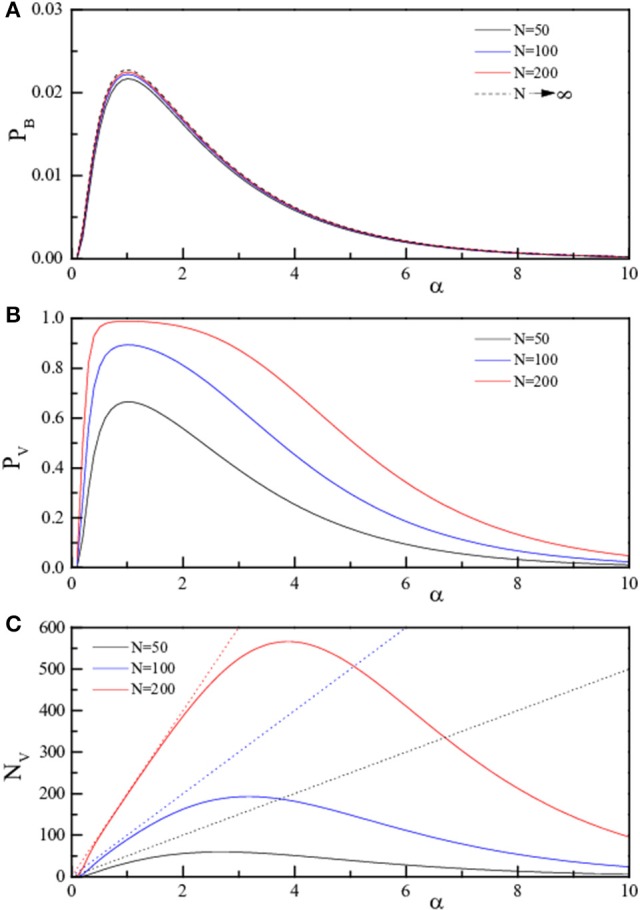
Figure 2.

Theoretical curves for the three quantities pB, pV, and NV (pB, Equation 4, A; pV, Equation 5, B; NV, Equation 6, C) reported as full lines. The three quantities are reported in linear scale as a function of α = P/N for fixed N. The values of N are 50 (black), 100 (blue), and 200 (red). The dotted lines in (C) represent NV = P.
