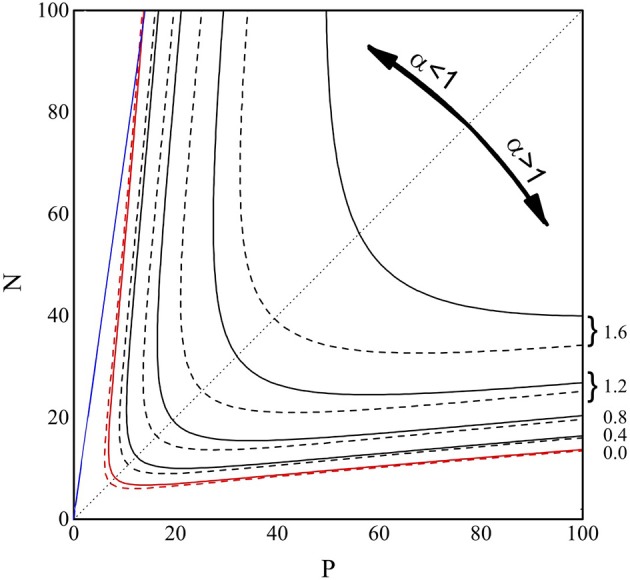
Figure 4.

Contour plot of log10(NV) from Equations (6) (full lines) and (8) (dashed lines), in the P and N range 0–100. The lines are the loci of the points where log10(NV) equals 0.0 (red), 0.4, 0.8, 1.2, and 1.6 (black), as indicated on the right side of the figure. The blue line represents P = 0.14N, while the black dotted line is the bisectrix N = P, plotted to emphasize the symmetry of the contour lines.
