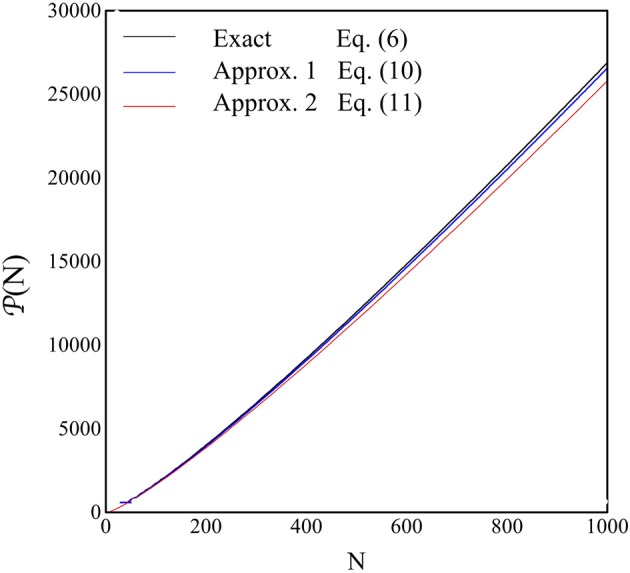
Figure 5.

The quantity P(N), i.e., the P-value where the perfect recovery is guaranteed, is shown as a function of N. The blue line is the numerical solution of NV = 1 from Equation (6), the blue line is the plot of Equation (12) and the red line is the plot of Equation (13).
