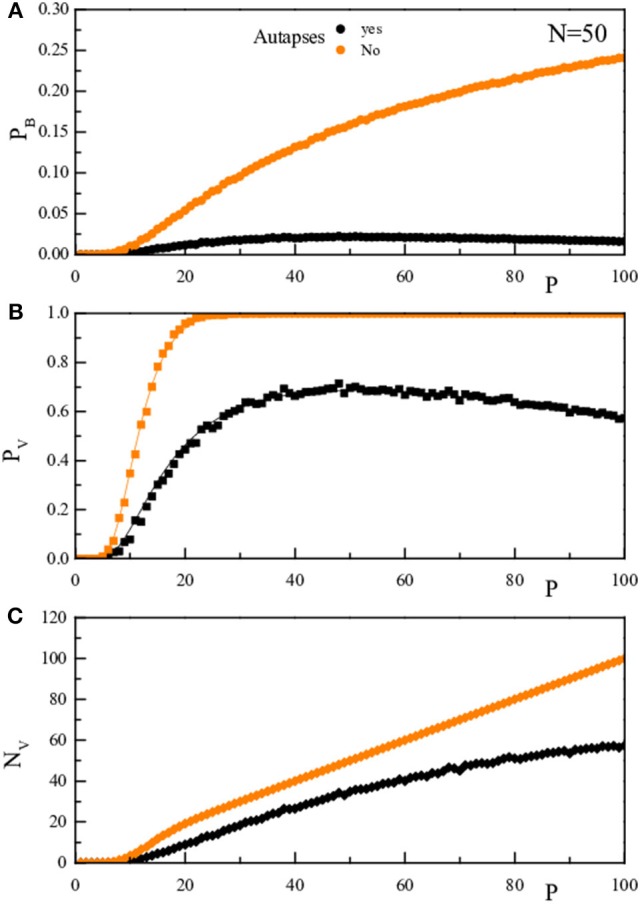
Figure 6.

The upper panel (A) reports for a given N-value (N = 50), as a function of P, the probability pB that, stimulating the network with a vector inside the training set, there is one bit wrong in the network response. The middle panel (B) reports pV, the probability that, stimulating the network with a vector inside the training set, the vector obtained after one dynamical step is not the stimulating vector. The lower panel (C) reports NV = PpV. The black symbols/lines refer to the case where the diagonal elements are as determined in Equation (2), while the oranges ones to diagonal elements forced to vanish. The full lines are the theoretical prediction, the full dots are the results of the numerical simulation.
