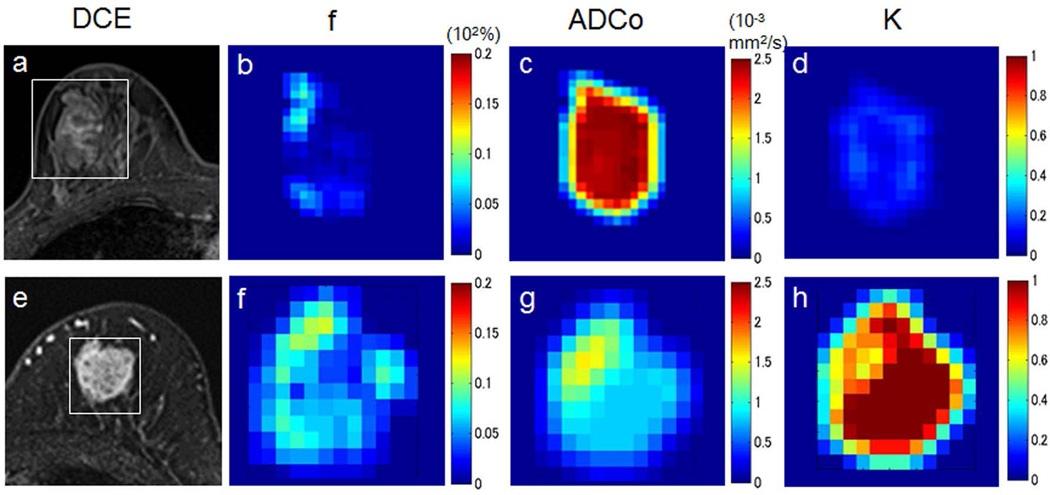
Figure 15.
Example breast IVIM/DKI analysis. Images and parametric maps in two patients with breast lesions. Upper row: Fibroadenoma in a 34-year-old woman. (a) Dynamic contrast-enhanced image shows weak and heterogeneous enhancement in the lesion (white box, area covered by parametric maps). (b) The f map shows very low perfusion in the lesion center, with slightly higher values visible in the left bottom and the upper parts. (c) The ADC0map shows high and homogeneous values throughout the lesion center, while the K map (d) shows very low values in the center. Such a high ADC0/low K pattern highly suggests the presence of a free-diffusion tissue component. Lower row: Invasive ductal carcinoma in a 74-year-old woman. (a) Dynamic contrast-enhanced image shows strong and heterogeneous enhancement in the lesion (white box, area covered by parametric maps). (b) High f values are observed in the peripheral area of the tumor. (c) The ADC0 values are low in the lesion, reflecting high tumor cellularity. In contrast, the K map (d) shows very high values, suggesting some diffusion hindrance effect (possibly from cellular membrane) of the lesion. (Courtesy of Mami Iima, MD, PhD, and Masako Kataoka, MD, PhD, Department of Diagnostic Imaging and Nuclear Medicine, Graduate School of Medicine, Kyoto University, Japan.)

