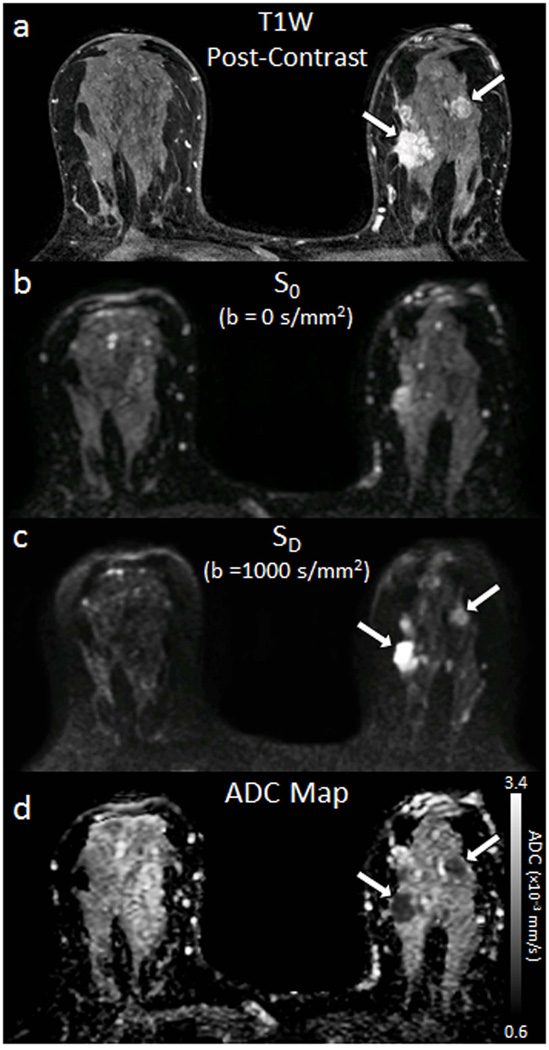
Figure 2.
Example breast images obtained with DWI. Shown are corresponding slices from (a) DCE post-contrast image as reference (b) S0 with b = 0 s/mm2 (primarily T2-weighted), (c) SD with b = 1000 s/mm2, (d) apparent diffusion coefficient (ADC) map. Invasive tumors (arrows) exhibit reduced diffusivity on DW imaging, appearing hyperintense on SD image (c) and hypointense on the ADC map (d).

